Download
1 / 24
240 likes | 245 Views
This study explores the evolution of cold gas density and star formation rate in galaxies at intermediate redshifts using the SDSS, DLAS, HIPASS, and HI emission survey. The limitations in current observational constraints and the need for the SKA sensitivity are discussed. The proof of concept is demonstrated through the stacking of HI emission signals from galaxies in the A3128 cluster and the Subaru field. The comparison of HI mass, star formation rate, and HI mass-to-light ratios in the A370 galaxy cluster and the Uppsala General Catalog is also analyzed.

E N D
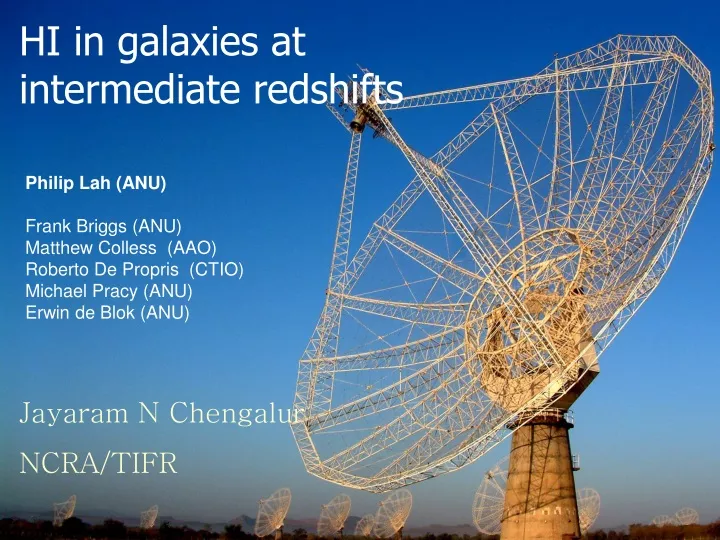
HI in galaxies at intermediate redshifts Philip Lah (ANU) Frank Briggs (ANU) Matthew Colless (AAO) Roberto De Propris (CTIO) Michael Pracy (ANU) Erwin de Blok (ANU) Jayaram N Chengalur NCRA/TIFR
Evolution of Wgas Star formation Rate Cold gas density SDSS DLAS HIPASS HI emission survey at z = 0 (Zwaan et al. 2005) Very limited constraints on the gas content (i.e. raw material for star formation) exist in the redshift range in which the star formation rate shows very rapid evolution Ly-aline not observable from the earth
Sensitivity Issues – need for SKA The flux from an MHI* galaxy at z ~ 1 is The time required to make a 3s detection with the GMRT is Clearly a much larger sensitivity is needed, i.e. the SKA
What can one do now? • The volume of space observed by the GMRT telescope in a single observation ~ (FoV x Bandwidth) could contain ~ 100 or more bright galaxies • One could try to detect the average HI emission of all of these galaxies by stacking • Stacking requires one to know the position and redshift of all galaxies
Proof of concept A3128 • Naively if one co-adds the HI emission signal from N galaxies, the SNR should improve by N½ • Redshift measurement errors lead to errors in aligning HI spectra • Unknown HI mass of each galaxy leads to non optimal weights while co-adding • HI mass depends on morphological type, optical diameter. • Unknown HI extent of each galaxy also leads to non optimal SNR • HI diameter correlates with optical diameter. • Low redshift cluster A3128 observed as “proof of concept” Begum, Chengalur, Karachentsev et al. (2008)
A3128 Chengalur et al. 2001 (also Zwaan et al. 2001) • A 3128 is a z ~ 0.06, richness class 3, Bautz-Morgan type I-II cluster • Redshifts available for 193 galaxies, of which 148 lie inside the ATCA cube • Co-added emission detected from cluster galaxies. • Late type galaxies located outside the X-ray contours have the highest HI content • MHI = 16.7 ± 2.6 (late type, outer) • MHI = 8.6 ± 2 (all galaxies) All late types Control Sample Late types outside X-ray contours
The Subaru field Fujita et al. (2003), narrow band Ha imaging at z ~0.24
H at z = 0.24 Narrow band Ha selected galaxies 24’ × 30’ Fujita et al. 2003 did a narrow band imaging survey for Ha emission at z=0.24 Total of 348 galaxies in the sample
1 km x 1 km • Hybrid configuration • 14 dishes in central compact array • Remaining along 3 “Y” arms • Allows one to simultaneously make low and high resolution images 14 km The Giant Meterwave Radio Telescope (GMRT) • Aperture Synthesis Radio Telescope (interferometer) • 30 Antennas each 45m in diameter • About 70 km N of Pune, 160 km E of Mumbai. Low and high angular resolution GMRT images of CH3CHO emission from Sgr B2 (Chengalur & Kanekar 2003) made from a single GMRT observation.
GMRT Observations • 121 galaxies within the GMRT data cube • Total of ~ 40 hours of on source time • Most of these galaxies are fainter than L* (i.e. low HI mass) • Redshifts obtained using the 2dF instrument on the AAT • Optical imaging with the ANU 40” telescope. • Smoothing sized fixed using DHI -Dopt relation from Broeils & Rhee (1997)
Stacked HI Spectrum and WHI 121 redshifts - weighted average MHI = (2.26 ± 0.90) ×109 M GMRT Measurement
Star Formation Rate at z = 0.24 shows same correlations as for z=0 galaxies SFR vs MHI z = 0 relation from Doyle & Drinkwater (2006) SFR vs Radio Continuum z = 0 relation from Sullivan (2001)
Abell 370, a galaxy cluster at z = 0.37 large galaxy cluster of order same size as Coma optical imaging ANU 40 inch telescope spectroscopic follow-up with the AAT GMRT ~34 hours on cluster
Abell 370 galaxy cluster Abell 370 galaxy cluster Extent of X-ray gas 324 galaxies 105 blue (B-V 0.57) 219 red (B-V > 0.57) R200 radius at which cluster 200 times denser than the general field
redshift histogram 324 useful redshifts GMRT sideband frequency limits
HI all spectrum 324 redshifts (all available) MHI = (6.6 ± 3.5) ×109 M
HI Mass in the inner regions of clusters HI mass within 2.5 Mpc of cluster centers A 370 has substantially more HI mass than the comparable richess Coma cluster
HI Mass to Light Ratios HI mass to luminosity ratios HI mass to optical B band luminosity for Abell 370 galaxies Uppsala General Catalog Local Super Cluster (Roberts & Haynes 1994)
HI Mass vs Star Formation Rate in Abell 370 all 168 [OII] emission galaxies Average line from Doyle & Drinkwater 2006
Summary • Galaxies in A370 (z ~ 0.37, Tlookback ~ 4 Gyr) have significantly more gas than those in the similar size nearby Coma cluster • A370 shows similar trends as for nearby clusters, e.g. • decrease in HI mass for central galaxies • Correlation of SFR with total HI content • Calibration between O[II] derived SFR and radio continuum derived SFR is the same as in the local universe • At the observed SFR, A370 will evolve into a gas poor cluster like Coma by z ~ 0 • Co-adding is a powerful method to study the HI content of star forming galaxies, galaxy evolution in clusters, substructure in clusters etc.
HI mass 324 galaxies 219 galaxies 105 galaxies 94 galaxies 156 galaxies 168 galaxies 110 galaxies 214 galaxies
Gas Rich Gas Poor A3128: Inhomogeneous distribution of gas rich galaxies Co-added spectra of the most gas rich group MHI ~ 26 x 109 Msun