Download
1 / 18
180 likes | 187 Views
This study explores the dynamics of CDOM (colored dissolved organic matter) in the upper ocean using a combination of laboratory experiments, satellite data, and global field observations. The study examines the factors controlling CDOM distribution, including transport, production, and loss processes. The impact of CDOM photolysis on global surface distribution and photochemistry is also assessed. The study presents a model for estimating CDOM photolysis rates using ocean color data.

E N D
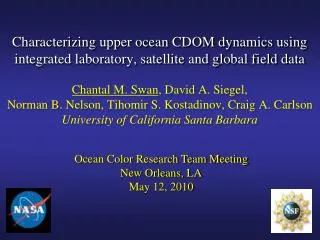
Characterizing upper ocean CDOM dynamics using integrated laboratory, satellite and global field dataChantal M. Swan, David A. Siegel, Norman B. Nelson, Tihomir S. Kostadinov, Craig A. CarlsonUniversity of California Santa Barbara Ocean Color Research Team Meeting New Orleans, LA May 12, 2010
CDOM in the Open Ocean • CDOM (m-1) = • light-absorbing DOM (≤0.2µm) • Open-ocean CDOM << DOM • Does not covary with Chl or DOC • on annual time scales • Destroyed by sunlight (photolysis) in surface ocean • Net produced through microbial remin. of DOC & POC • These processes modulated by transport • Dominates non-water UV absorption in ocean (up to 90%) • CDOM causes measurable bias in satellite Chl estimates [Siegel et al. 2005] CDOM Spectrum Absorption coefficient (m-1) at 325 nm
CDOM in the Open Ocean UCSB Global CDOM Survey (2003 – present) Cruise transects of U.S. CO2/CLIVAR Repeat Hydrography Program P2 A22 A20 P16 I9N P6 A16 I8S P18 I6S 7-yr mean (1997 – 2005) colored dissolved and detrital materials (“CDM” m-1, 443 nm) estimated from GSM algorithm [Siegel et al. 2002] using SeaWiFS
Measuring CDOM in the Open Ocean • 0.2-μm filtered water samples collected from niskins • 1.93 m liquid waveguide spectrophotometer = detection of low CDOM • Refractive index correction for salinity of samples • Spectral Slope (S) estimation: • aCDOM(λ) = aCDOM(λo) e – S (λ –λo) CDOM Spectra
SALINITY [psu] CDOM in the Pacific[Swan et al., DSR-I, 2009] 150°W acdom325 [1/m] NPIW AAIW CDW AOU vs. CDOM (z > 100m) AABW r2 = 0.81,n = 1522 P16 • Pacific basin characterized by weak ventilation and • strong meridional gradient in CDOM and biogeochemical properties
acdom325 [1/m] STMW STMW NADW Deep Caribbean STMW Deep Caribbean NADW CDOM in the North Atlantic[Nelson et al., DSR-I, 2007] A22 (66°W) AOU vs. CDOM (z >100m) r2 = 0.17, n=617 • Low variability of CDOM in deep waters • Rapidly advecting NADW = dominant process for CDOM distribution in N. Atlantic • Strong mode water signal (STMW) = photobleached surface waters entrained
Controls on the open ocean CDOM distribution • CDOM distribution is controlled by the relative strengths of: • transport • (ventilation, advection, upwelling) • production • (microbial transformations of • DOC & POC) • loss • (photolysis in surface waters)
CDOM Photolysis • Moderates global surface distribution of CDOM • Moderates photochemistry • (e.g., CO2, CO, COS release, DMS photolysis) Determination of the apparent quantum yield () = loss of CDOM absorption per unit of light absorbed • 15 samples from the major ocean basins • Shore-based laboratory incubations using simulated solar irradiation see Swan et al. OCRT POSTER
Simulates spectrum and intensity of terrestrial irradiance = = Solar Light Co. LS1000 Solar Simulator (Dark Control) CDOM Photolysis Experimental Design: in situ T°C • 2 days in simulator ≈ 11 days* in surface ocean ≈ 57 days* in mixed layer • *estimates based on mean daily insolation at 325nm, MLD, and CDOM/light attenuation in mid-Atlantic in spring [Zafiriou et al. 2008] • Time course of CDOM absorption = photolysis rate = daCDOM(λo)/dt
d(aCDOM(λo))/dt = ∫Φ(λo;λi) Eo (λi) āCDOM (λi) dλi CDOM Photolysis Analytical Approach: Φ(λo;λi) = A(λo) e - B(λo)(λi – λref) A and B coefficients solved by inversion daCDOM/dt = m-1 s-1 A = m2 mol photons-1 λref = 300nm Φ = m2 mol photons-1 B = nm-1 Eo= mol photons m-2 s-1 nm-1 λo = observation (nm) āCDOM = m-1 λi = irradiation (nm)
daCDOM/dt (measured) E0*ācdom E0*ācdom*(o=325nm) Time Time Time Schematic of inversion terms: d(aCDOM(λo))/dt = ∫Φ(λo;λi) Eo (λi) āCDOM (λi) dλi aCDOM(λo) d(aCDOM(325))/dt Eo(λi) λo (nm) exposure time (days) λi (nm) (325;λi) (325;λi)*Eo(λi)*āCDOM(λi) Eo(λi)*āCDOM(λi) λi (nm) λi (nm) λi (nm)
Controls on quantum yield (Φ) variability in the open ocean? Φ(325,λi) Is Φ = f (z, T, salinity, O2, N, P, Si, Fe2+, DOC, Chl-a, initial aCDOM, initial S, N:P, Si:N, AOU) ?
A model for apparent quantum yield (Φ) for CDOM photolysis in the open ocean: • (o;i) = 0(o;i)+ 1(o;i) (AOU) + 2(o;i) (N:P) + 3(o;i) (S) • 0(325;325) = -0.1826 m2 mol photons-1 • 1(325;325) = -0.0002 m2 mol photons-1mol-1 kg • 2(325;325) = 0.0035 m2 mol photons-1 • 3(325;325) = 4.3485 m2 mol photons-1nm • Up to 95% of variability in apparent quantum yield is • explained by AOU, N:P and initial S of the samples Action Spectrum Table of r2 values (p < 0.04, n = 14) (325;λi)*Eo(λi)*āCDOM(λi) [Swan et al., submitted]
How to apply ocean color data to estimate global CDOM photolysis rate? d(aCDOM(λo))/dt = ∫Φ(λo;λi) Eo (λi) āCDOM (λi) dλi (325;λi)*Eo(λi)*āCDOM(λi) • 310 – 350 nm wavelengths primarily responsible for CDOM photolysis • Need CDOM and Eo measurements in the UV • Remote-sensed estimates of colored dissolved and detrital materials (‘CDM’) are at 443 nm
Extrapolating satellite-retrieved absorption by colored dissolved and detrital materials, ‘CDM’ (m-1, 443 nm), into the UV Spectral slope (S, nm-1) as a function of the CDOM absorption coefficient (m-1, 443 nm) CLIVAR global fieldCDOMdata r2 = 0.73, n = 7611 Ŝ = 0.013 + 0.017*e-75.184*CDOM(443)
Estimating CDM UV absorption from satellite: Ŝ = 0.013 + 0.017*e-75.1842.*aCDM(443) aCDM(λ) = aCDM(443)*e –Ŝ(λ-443) all cruises surf. data (z < 7m) n = 277, p<0.001 325nm: r2 = 0.79 340nm: r2 = 0.79 380nm: r2 = 0.75 412nm: r2 = 0.65 extrapolated CDM vs. measured CDOM SeaWiFS(GSM) aCDM (m-1) spectroscopic aCDOM (m-1)
Estimating CDM absorption in the UV from satellite: Next step: monthly climatologies of CDM(UV)
FUTURE STEPS Estimate depth-resolved CDOM photolysis rates in the global ocean: d(aCDM(λo))/dt= ∫∫ Es (λi)e-kd(λi)z aCDM (λi) Φ(λo;λi;AOU;N:P;S) dλi dz (integrated over λi and z = surf – MLD PROPOSED DATA SOURCES ES(UV-VIS): TOMS, SeaWiFS aCDM(UV-VIS) and S: GSM output (443nm) and Global S Model kd = model (Bonhommeau et al., in prep) z = MLD from FNMOC O2, N, P = NODC