Download
1 / 41
430 likes | 623 Views
Chapter 2 Image Formation. Chuan-Yu Chang ( 張傳育 )Ph.D. Dept. of Computer and Communication Engineering National Yunlin University of Science & Technology chuanyu@yuntech.edu.tw http://mipl.yuntech.edu.tw Office: ES709 Tel: 05-5342601 Ext. 4337. Image Formation.

E N D
Chapter 2Image Formation Chuan-Yu Chang (張傳育)Ph.D. Dept. of Computer and Communication Engineering National Yunlin University of Science & Technology chuanyu@yuntech.edu.tw http://mipl.yuntech.edu.tw Office: ES709 Tel: 05-5342601 Ext. 4337
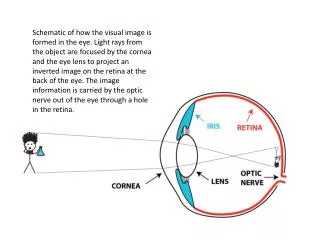
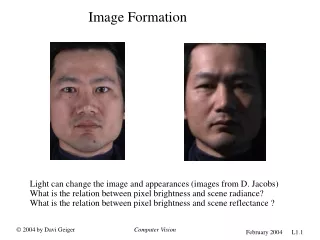
Image Formation • Through medical imaging modalities, 2-D and 3-D images of an organ can be obtained using transmission, emission, reflectance, diffraction, nuclear resonance… • 4-D time-varying image sequences of a 3-D organs, ex. beating heart. • An analog image is described by the spatial distribution of brightness or gray-levels that reflect a distribution of detected energy. • The image can be displayed using a medium such as paper or film. • The image may show • A black-and-white image with gray-levels representing. • A true color image with red, green, and blue components.
Image Formation • Three basic colors, red, green and blue (RGB) could be used as three variables for representing color images. • When combined together, the red, green and blue intensities can produce a selected color at a spatial location in the image.
Color Models • The RGB Color Model • Each color appears in its primary spectral components of red, green and blue . • The number of bits used to represent each pixel in RGB space is called the pixel depth. Schematic of the RGB color cube.
Color Models (cont.) • Example • Generating the hidden face planes and a cross section of the RGB color cube. RGB 24-bit color cube The three hidden surface planes
Color Models (cont.) • Example (cont.) Generating the RGB image of the cross-sectional color plane (127, G, B)
Color Models (cont.) • Safe RGB color, All-system-safe color, Safe Web color, Safe browser color • 216 colors are common to most systems • Each of the 216 safe colors is formed from three RGB values, each value can only be 0, 51, 102, 153, 204, or 255. • The values 000000 and FFFFFF represent black and white, respectively. The RGB safe-color cube
Color Models (cont.) Valid values of each RGB component in a safe color The 216 safe RGB colors All the grays in the 256-color RGB system
Color Models (cont.) • The HSI Color Model • When humans view a color object, we describe it by its hue, saturation, and brightness. • Hue is a color attribute that describes a pure color. • Saturation gives a measure of the degree to which a pure color is diluted by white light. • Brightness is a subjective descriptor that is practically impossible to measure. (所以用intensity來取代brightness) • HSI color model decouples the intensity component from the color-carrying information (hue and saturation) in a color image.
Color Models (cont.) • Conceptual relationships between the RGB and HSI color models • Intensity的強度是沿著黑色(0,0,0)和白色(1,1,1)兩點的直線。 • HSI色彩空間是由一垂直intensity軸,以及位於平面上與此軸垂直的彩色點軌跡所表示。
Color Models (cont.) • HSI describe colors as points in a cylinder whose central axis ranges from black at the bottom to white at the top with neutral colors between them, where angle around the axis corresponds to “hue”, distance from the axis corresponds to “saturation”, and distance along the axis corresponds to “lightness”, “value”, or “brightness”. • HSI conceptually represents a double-cone or sphere (with white at the top, black at the bottom, and the fully-saturated colors around the edge of a horizontal cross-section with middle gray at its center).
Color Models (cont.) Converting colors from RGB to HSI
Color Models (cont.) • Converting colors from HSI to RGB • RG sector • GB sector • BR sector
y b Radiating Object f(a,b,g) Image g(x,y,z) Image Formation System h g z Image Domain Object Domain x a Image Coordination System • In the process of image formation, the object coordinates are mapped into image coordinates. • G=R(F-T) • where G and F are image and object domain coordinate systems. • R and T are rotation and translation matrices. • Translation is a vector subtraction operation • Scaling is a vector multiplication operation. • In 3D rotation, three rotations about three axes can be defined in a sequence to define the complete rotation transformation.
Image Coordination System (cont.) • Rotation of G(a,b,g) about b by an angle qsuch that • Rotation of about a by an angle fsuch that
Image Coordination System (cont.) • Rotation of about b by an angle ysuch that
Linear System and Impulse Response • Image formation system is a linear spatially invariant system • The response of imaging system should be consistent, scalable and independent of the spatial position of the object being images. • A system is said to be linear if it follows two properties: scaling and superpositionwhere a and b are scalar multiplication factorsI1(x,y,z) and I2(x,y,z) are two inputs to the system represented by the response function h. • In real-world situation, it is difficult to find a perfectly linear image-formation system. • Non-linear system can be modeled with piecewise linear properties under specific operating considerations.
b y Radiating Object Image Image Formation System h Selected Cross-Section g z Image Domain Object Domain x a Radiation Source Reconstructed Cross-Sectional Image Principle of Image Formation 經過image-formation system的轉換,將反射量轉換成物體影像。 • Image Formation: External Source 物體接受放射源的照射,並產生反射。 放射源(可能是光或輻射) ,照射某物體。
b y Image Radiating Object Image Formation System h Selected Cross-Section g z Image Domain Object Domain x a Reconstructed Cross-Sectional Image Principle of Image Formation • Image Formation: Internal Source 經過image-formation system的轉換,將輻射射量轉換成物體影像。 放射物體發出輻射。
y x z f(x1,y1) Pin-hole g(x2,y2) z1 z2 Object Plane Image Plane Focal Plane Pin-Hole Imaging • The pin-hole imaging method is used in many biomedical imaging systems including the nuclear medicine imaging modalities SPECT and PET. • The radiation from the object plane enters into the image plane through a pin-hole. • The pin-hole is called the focal plane.
Magnification factor Pin-Hole Imaging • If a point in the object plane is considered to have (x1, y1, -z1) coordinates mapped into the image plane as (x2, y2, z2) coordinates, then • Generalizing the object plane with two-dimensional coordinate system (a,b) and the corresponding image plane with the coordinate system (x,y), the general response function can include the magnification factor M so that the image formation equation can be expressed as
Fourier Transform • Fourier Transform is a linear transform that provides information about the frequency spectrum of the signal. • Used in image processing for image enhancement, restoration, filtering and feature extraction to help image interpretation and characterization. • Used in image reconstruction methods for medical imaging systems. • The Fourier Transform can be applied to a signal to obtain frequency information.
Fourier Transform (cont.) • A two dimensional Fourier Transform, FT of an image g(x,y) is defined as • Since Fourier Transform is a linear transform, the inverse transform can be used to obtain the original from spatial frequency information if no filtering is performed in the frequency domain. • A two-dimensional inverse Fourier transform is defined as
Fourier Transform (cont.) • Fourier transform provides a number of useful properties for signal- and image- processing application including: • Linearity • Scaling • Translation
Fourier Transform (cont.) • Convolution • Cross-correlation • Auto-correlation • Parseval’s Theorem • Separability
128 128 Fourier Transform 在空間域的垂直條紋,在頻率欲將呈現水平方線的脈衝亮點 Figure 2.5. (a) A vertical stripe image generated from a sinusoidal waveform of a period of 8 pixels and (b) the logarithmic magnitude image of its Fourier transform Figure 2.6. (a) A rotated stripe image and (b) the logarithmic magnitude image of its Fourier transform.
Fourier Transform Figure 2.7. (a) An image with a square region at the center and (b) the logarithmic magnitude image of its Fourier transform.
Radon Transform • The random transform defines projections of an object mapping the spatial domain of the object to its projection space. • Let us define a two-dimensional object function f(x,y) and its Randon transform by R{f(x,y)}. • The Radon transform is defined by the projection P(p,q) in the polar coordinates systems aswhere the line integral is defined along the path L such that
y q p f(x,y) q x p P(p,q) q Line integral projection P(p,q) of the two-dimensional Radon transform. Radon Transform (cont.) Sampled along the p axis and are defined by the angle q. 將箭頭方向上所有f(x,y)相加(積分) ,可獲得p方向上的投影值。 將物體投影到P(p,q) 也就是方向p,角度q的投影。
Radon Transform (cont.) • The polar coordinate system (p,q) can be converted into rectangular coordinates in the Randon domain by using a rotated coordinate system (p,q)The above implies
Projection p1 A Reconstruction Space B Projection p3 Projection p2 Radon Transform (cont.) • The significance of using the Randon transform for computing projections in medical imaging is that an image of a human organ can be reconstructed by back-projecting the projections acquired through the imaging scanner. The reconstructed objects may have geometrical or aliasing artifacts because of the limited number of projections used in the imaging and reconstruction objects, a large number of projections should be used.
Sampling • Whether the spatial sampling frequency is adequate to capture the fine details of the object? • Nyquist criterion determine the optimal sampling rate for discretization of an analog signal without the loss of any frequency information. • To avoid any loss of information or aliasing artifact, an analog signal must be sampled with a sampling frequency that is at least twice the maximum frequency present in the original signal.
Sampling (cont.) • In sampling a 1-D signal, a sampling function is defined as a series of 1-D delta functions. • For a 2-D image, a 2-D distribution of delta functions is defined aswhere △x and △ y are the spacing of data points to be sampled in x and y directions. Figure 2.10. (a) A 2-D distribution of Gaussian impulses in the spatial domain and (b) its representation in the Fourier domain.
Sampling (cont.) • The sampled version of the image fd[x,y] is given by • Let’s consider, wx and wy to be the spatial frequencies in x and y direction, and Fs( wx, wy) to be the Fourier transform of the sampled image fd[x,y]. Using the convolution theoremwhere Fa(wx, wy) is the Fourier transform of the analog image fa(x,y) and wxs and wxy represent the Fourier domain sampling spatial frequencies such that
Sampling (cont.) • For a good discrete representation, the sampling process must not cause any loss of frequency information. • The multiplication operation of fa(x,y) with the sampling signal s(x,y) would create a convolution operation in the Fourier domain resulting in multiple copies of the sampled image spectrum with the 2p/△x and 2p/△y spacing in wx and wy directions, respectively. • To recover the signal without any loss, the multiple copies of the image spectrum must not overlap. • The overlapped region of image spectrum will create aliasing and the original signal or image cannot be recovered by any filtering operation.
(a) wy wymax Fa(wx, wy) wx wxmax -wxmax -wymax Sampling (cont.) • Assume that the image as the 2-D signal in the spatial domain is band limited, that is, the Fourier spectrum Fa(wx, wy) is zero outside the maximum frequency components wxmax and wymax in x and y direction.
(b) Sampling (cont.) • To avoid overlapping of image spectra, it is necessary thatand fxmaxand fymax are the maximum spatial frequencies available in the image in x and y direction. Good sampling of the band-limited image signal
Overlap regions (c) Sampling (cont.) Since the sampling frequency is lower than the Nyquist rate, multiple copies of the sampled spectrum overlap causing the loss of high-frequency information in the overlapped regions. Result in aliasing artifacts in the image To remove the aliasing artifact, a low-pass filter is required in the Fourier domain
Log |F(wx, 0)| wx Log |F(wx, 0)| Sampling (cont.) Logarithmic magnitude of the Fourier transform of the sinusoidal signal Sinusoidal signal of a period of 1.8 pixels
Discrete Fourier Transform • The Discrete Fourier Transform (DFT), F(u,v) of an image f(x,y) is defined aswhere u and v are frequency coordinates in the Fourier domain. • The inverse DFT in two dimensions can be defined as • The numerical implementation of DFT and Fast FT (FFT) may make some approximations and finite computations. • These errors may cause artifacts in the image spectrum and may not allow an implementation of Fourier transform to be exactly reversible.