Download
1 / 4
50 likes | 137 Views
Identifying Forest Change with SAR. March 2010. Martin Whittle Shaun Quegan University of Sheffield. HH. Deforestation. HV. HH/HV. Landsat vs. SAR. Deforestation. Landsat 5 2006/09/03. Landsat5 2008/06/20. ALOS PALSAR.

E N D
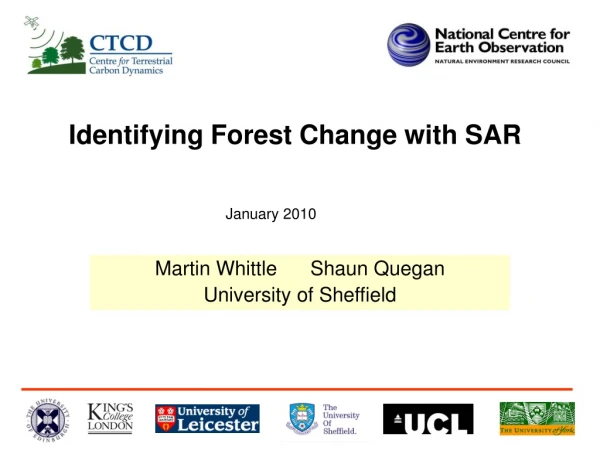
Identifying Forest Change with SAR March 2010 Martin Whittle Shaun Quegan University of Sheffield
HH Deforestation HV HH/HV Landsat vs. SAR Deforestation Landsat 5 2006/09/03 Landsat5 2008/06/20 ALOS PALSAR The Landsat image above was the best available from the time and emphasises the difficulty of using optical Imagery to develop accurate databases. SAR does not suffer from cloud problems
Jan 2007 Sept 2007 June 2008 Temporal ScanSAR image of Kampar region Each HH image has been de-noised by multi-channel filtering. Pixel size: 100 X 100 m Image size: 128 X 91.8 Km
Detections compared with database deforestation TP – True positive (correct detection) FP – False positive (false alarm) FN – False negative – missed detection