1 / 22

Disappearing Asymptotes

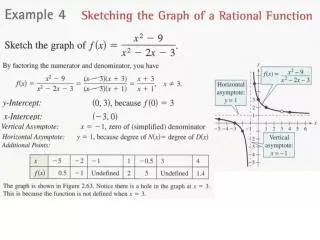
Disappearing Asymptotes. The Visual Answers. Consider the graph of the function defined by:. Disappearing Asymptotes:. And then, the graph of the function defined by:. hole in the graph!. hole in the graph!. Again:.

Download Presentation

Disappearing Asymptotes

An Image/Link below is provided (as is) to download presentation Download Policy: Content on the Website is provided to you AS IS for your information and personal use and may not be sold / licensed / shared on other websites without getting consent from its author. Content is provided to you AS IS for your information and personal use only. Download presentation by click this link. While downloading, if for some reason you are not able to download a presentation, the publisher may have deleted the file from their server. During download, if you can't get a presentation, the file might be deleted by the publisher.

E N D

Presentation Transcript


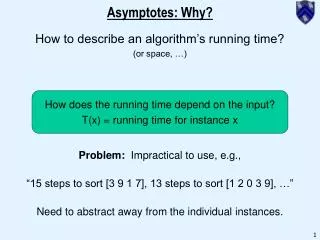
  1. Disappearing Asymptotes The Visual Answers

  2. Consider the graph of the function defined by: Disappearing Asymptotes:

  3. And then, the graph of the function defined by:

  4. hole in the graph!

  5. hole in the graph! Again:

  6. Consider the graph of a series of rational functions with denominator of the form x – a, where 1 < a < 2. Keep your eye on: 1) the position of the vertical asymptote 2) the diagonal distance between the two “halves” of the graph.

  7. hole in the graph!

  8. Extension: • What would happen if we explored the same relationship from the left side of the asymptote? i.e. • How would the graph change, etc.?

More Related