Download

1 / 14
140 likes | 216 Views
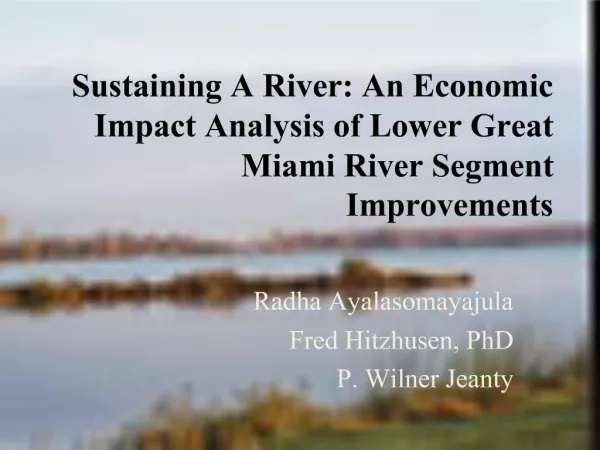
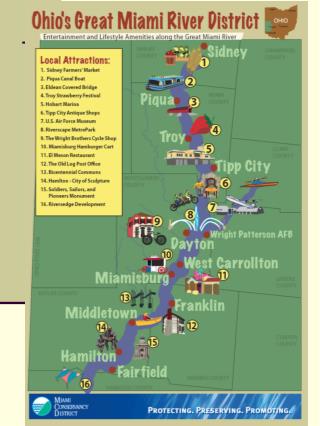
Upper Great Miami River. Chenoa Courtney, Kristin Gunn, and Megan Lonsdale. The Upper Great Miami River is located throughout several counties. Including: Auglaize, Hardin, Mercer, Champaign, and Logan There are 245 total stream miles 117.4 miles of the stream were assessed.

E N D
Upper Great Miami River Chenoa Courtney, Kristin Gunn, and Megan Lonsdale
The Upper Great Miami River is located throughout several counties. Including: Auglaize, Hardin, Mercer, Champaign, and Logan • There are 245 total stream miles • 117.4 miles of the stream were assessed
Kristin’s Hypothesis Hypothesis: As the Total Suspended Solids increase the QHEI (quality of habitat) and the ICI (diversity of macro-invertebrates) decrease.
Data Analysis As TSS decreases, ICI and QHEI increases.
Conclusion: • The Total Suspended Solids cover up the macroinvertebrate’s habitat. • Since the quality of their habitat decreases, the macroinvertebrate’s population also decreases. • My hypothesis was supported
Chenoa’s Hypothesis When the substrate quality decreases, the QHEI also decreases
Agriculture within 90 meters of the river can lower the QHEI. When farmers work the land at the edge of the stream, pesticide run-off kills sensitive fish, which lowers the QHEI, which in turn lowers the IBI. My hypothesis was supported. Conclusion
Megan’s Hypothesis As DO (dissolved oxygen) increases, so will the IBI (diversity of fish).
My graph shows that as the DO increases the IBI also increases.
Conclusion • The Upper Great Miamihas very good DO with a healthy fish community • Fish cannot live without oxygen, so therefore the IBI depends on the DO • The DO is important because fish that are sensitive will not live in the creek/stream if there was low DO • My hypothesis was supported
To Increase ICI, IBI, and QHEI • Don’t remove the cover (removing the cover would cause the DO level to drop) , rocky substrate, or meander (curves in the stream) from the stream • Don’t farm within 90 meters of a creek/river
Thanks! Steve Shannon Paula Kathryn Virginie Leslie