Download
1 / 11
110 likes | 263 Views
The Relationship Between T-Cells and HIV Progression. Kiran Dhillon and Kelly Nuibe. HIV: Human Immunodeficiency Virus. T Cell. Courtesy of http://webs.wichita.edu/mschneegurt/biol103/lecture15/hiv_cellbinding.gif. Biological Variables and Parameters. V = virus particles

E N D
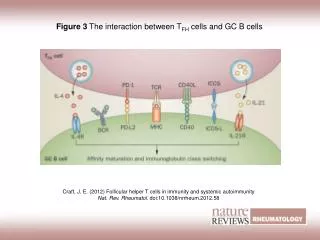
The Relationship Between T-Cells and HIV Progression Kiran Dhillon and Kelly Nuibe
HIV: Human Immunodeficiency Virus T Cell Courtesy of http://webs.wichita.edu/mschneegurt/biol103/lecture15/hiv_cellbinding.gif
Biological Variables and Parameters V = virus particles I = productively infected cells P = rate per cell C = clearance rate
Predator-Prey Models • Target T-Cell Limitation: Logistic Model Activated T Cell Model • Immune Control Model Courtesy of http://www.epidemic.org/theFacts/images/deformationOfRC.gif
Target T Cell Limitation: Logistic Model γ = combines all other virus induced depletion of the CD4 T cells α= 0.1 day-1 rate of increase; the max rate of T cell renewal Tmax = 1000 cells µL-1, non-infected steady state CD4 count Ttot = T+I T = target cells I = productively infected cells V = equation 1 β= true infection rate (cells per particle per day) δ1= 0.5 day-1, turnover rate of productively infected T cells
Target T Cell Limitation: Activated T Cell Model T = activated CD4 cells αQ = rate at which quiescent T cells are activated δQ = rate they die at β = rate at which activated CD4 cells are infected by virus r = rate at which activated CD4 cells revert back to the quiescent state 2rT/(1+Ttot/Tmax) = defines a density dependent regulation of the proliferation rate Ttot = Q+T+I
Immune Control Model Immune Response (CD8 Cells, aka “Killer Cells”) VIRUS Courtesy of http://www.karencarr.com/Images/Gallery/2004_gallery_steggy_and_allosaur.jpg
Immune Control (continued) When V is at an equilibrium state Ē = pβ/cK, E: cytotoxic effector T cells