Download

1 / 8
80 likes | 98 Views
Heating Curves. Energy and Phase Change. When adding heat to a solid, energy added increases the temperature and entropy until the melting point is reached

E N D
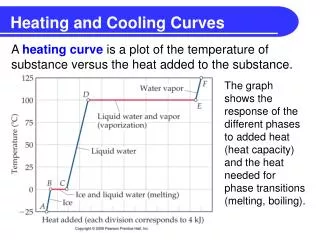
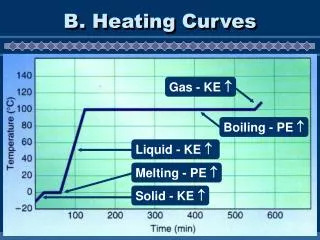
Energy and Phase Change • When adding heat to a solid, energy added increases the temperature and entropy until the melting point is reached • When the melting point is reached, all energy added is used to break intermolecular forces and increase the entropy (does not increase temp) • During melting both liquid and solid are present • Melting and freezing point are the same value
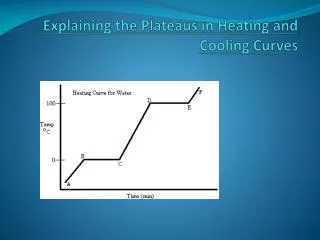
Heating Curve for Water 120 Steam Water and Steam 100 80 60 Water 40 20 Water and Ice 0 Ice -20 40 120 0 220 760 800 Melting Point Solid
Evaporation • When energy is added to a liquid, its temperature and entropy increase until the boiling point is reached • Once boiling point is reached, all energy added breaks intermolecular forces and increases entropy (does not increase temp) • Both liquid and gas present • Boiling and condensation point are the same
Heating Curve for Water 120 Steam Water and Steam 100 80 60 Water 40 20 Water and Ice 0 Ice -20 40 120 0 220 760 800 Boiling Point Liquid
After all liquid has evaporated only the gas phase remains and any heat added increases both temp and entropy
Heating Curve for Water 120 Steam Water and Steam 100 80 60 Water 40 20 Water and Ice 0 Ice -20 40 120 0 220 760 800 Gas
Draw a cooling curve and describe the changes that occur during each phase change