Download
1 / 5
50 likes | 211 Views
Gas - KE . Boiling - PE . Liquid - KE . Melting - PE . Solid - KE . B. Heating Curves. B. Heating Curves. Temperature Change change in KE (molecular motion) depends on heat capacity. Heat Capacity energy required to raise the temp of 1 gram of a substance by 1°C

E N D
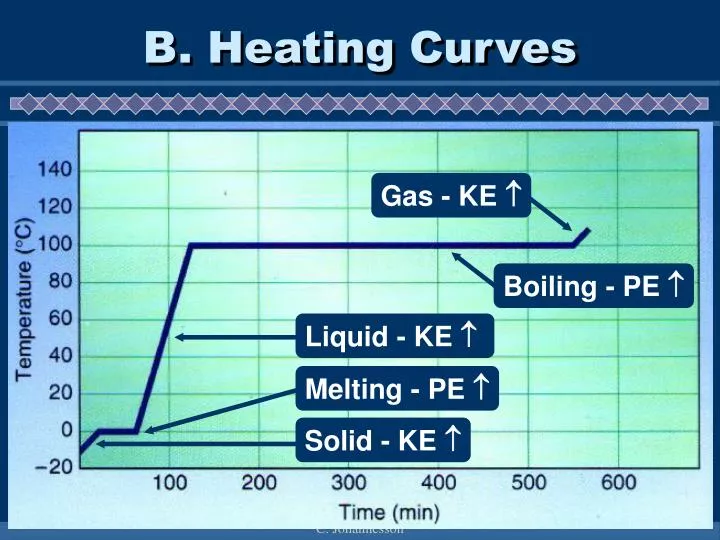
Gas - KE Boiling - PE Liquid - KE Melting - PE Solid - KE B. Heating Curves C. Johannesson
B. Heating Curves • Temperature Change • change in KE (molecular motion) • depends on heat capacity • Heat Capacity • energy required to raise the temp of 1 gram of a substance by 1°C • “Volcano” clip - water has a very high heat capacity C. Johannesson
B. Heating Curves • Phase Change • change in PE (molecular arrangement) • temp remains constant • Heat of Fusion (Hfus) • energy required to melt 1 gram of a substance at its m.p. C. Johannesson
B. Heating Curves • Heat of Vaporization (Hvap) • energy required to boil 1 gram of a substance at its b.p. • usually larger than Hfus…why? • EX: sweating, steam burns, the drinking bird C. Johannesson
C. Phase Diagrams • Show the phases of a substance at different temps and pressures. C. Johannesson