Download
1 / 29
290 likes | 302 Views
Development of a Tool for Downscaling of Operational Climate Forecasts to Regional and Local Fire Indices. 1,2 Nicole M ölders & 1 Gerhard Kramm University of Alaska Fairbanks 1 Geophysical Institute 2 College of Natural Sciences, and Mathematics. Motivation.

E N D
Development of a Tool for Downscaling of Operational Climate Forecasts to Regional and Local Fire Indices 1,2Nicole Mölders & 1Gerhard Kramm University of Alaska Fairbanks 1Geophysical Institute 2College of Natural Sciences, and Mathematics
Motivation • Wildfires reduce visibility => affect land and air traffic • Released aerosols and trace gases reduce air quality • PM2.5 may affect health • Destruction of properties • Natural treat with high occurrence nearly worldwide • … • Agencies need data for planning fire management several months ahead a fire season • A tool to provide suitable data for support in decision making and planning is required
High temporal variability in wildfire frequency and area burned Modified after Mölders and Kramm (2006)
Fire weather assessment difficult ahead of a season or when data are sparse • Operational climate model predictions are too coarse • Higher resolution non-linearly slows down the CPU and turnaround time • Only 7 first class sites in Interior Alaska • 21 additional sites of unknown data quality run by volunteers for limited amount of quantities • Clouds or smoke from existing fire may affect remote sensing • None of the above methods permits 3 months ahead assessment of fire risk as required by regional fire agencies for planning
Moisture, temperature and wind dependent Fosberg Fire Weather Index typically used for fire risk assessment Temperature Equilibrium moisture content Moisture damping coefficient Relative humidity Fosberg Fire Weather Index (FFWI) Wind factor Wind speed after Goodrick (2002)
Fosberg Fire Weather Index obtained from climate simulations not very helpful FFWI (-.-) Arctic Ocean Alaska Canada
Modified Fosberg Fire Weather Index (mFFWI) by inclusion of Keetch-Byram Drought Index (KBDI) and fuel availability observations model Spatially varying fuel availability factor FFWI Modified FFWI
Heterogeneous precipitation distribution requires spatial fuel availability factor 30-average observed precipitation according to the GPCC (color) and as simulated by CCSM (solid lines)
Dryness yields to high fuel availability Arctic Ocean Arctic Ocean
mFFWI obtained from climate simulations lacks regional details FFWI (-.-) Arctic Ocean modified FFWI (-.-) Arctic Ocean Improvement compared to FFWI, but too coarse
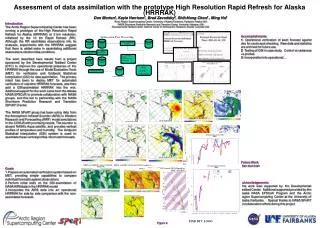
Schematic to bridge operational climate forecasts to regional and local mFFWI weekly mFFWI maps for quick-looks daily mFFWI maps for analysis WRF nested runs in endangered areas daily mFFWI local maps 6-hourly forcing data if required operational climate forecasts WRF statistical analysis to derive relationships, evaluation, improvement, etc. data base of climate model data plus derived mFFWI, regional model data plus derived mFFWI, observations observations
Schematic of time staggering for mFFWI ensembles operational climate forecasts • start procedure 3 month ahead a fire season for guesstimates • repeat procedure until end of the fire season if a “real” month is over WRF simulations every x days for 5d mFFWI form various WRF runs started at different times envelop of mFFWI local mFFWI time
Application of WRF for 4 km x 4 km grid increments 6-27-2005 1400 AST
Great horizontal variability of fuel availability factorwithin the Interior
6-27-2005 1400 AST 6-27-2005 1400 AST Importance of consideration of fuel availability within the region
Modified FFWI derived from scare meteorological observations often shows lower fire risk than FFWI
Fires in June 2005 2005/06/26 2050 UT Fires in Alaska and Yukon Territory Terra http://rapidfire.sci.gsfc.nasa.gov/gallery/?search=alaska&date 2005/06/14 2215 UT Fires in eastern Alaska Aqua http://rapidfire.sci.gsfc.nasa.gov/ gallery/?search=alaska&date
Evaluation of simulated (m)FFWI difficult • Not every area with high (m)FFWI burns • Network density (4 sites in Interior Alaska) • Complex terrain, low representativeness • Random errors due to initial and boundary conditions or observations • Systematic errors from consistent misrepresentation of geometrical, physical, or numerical factors • Error propagation in measurements/simulations • Actual fires and burned areas affect temperature, humidity, precipitation • Overall evaluation recommended
Small uncertainty of (m)FFWI from propagation of measurement errors Where stands for FFWI or mFFWI and is RH, T, v, P Assume: (RH)= 5% (T)= 0.5K (v)= 0.5m/s (P)= 0.01inch Note that uncertainty of FFWI and mFFWI will only differ if precipitation occurs
WRF well provides modified FFWI Note that McGrath and Northway airports are outside the WRF model domain!
Forecast errors propagate in mFFWI Simulation started 6-11-2005 0600 UT valid for 6-11-2005 2300 UT (1400 AST) Simulation started 6-7-2005 0600 UT valid for 6-11-2005 2300 UT (1400 AST) • Errors in P yield errors in soil moisture, FAF, KBDI, mFFWI • Errors in T yield errors in RH, FFWI, mFFWI • Errors in RH yield errors in FFWI, mFFWI • Errors in v yield errors in FFWI, mFFWI • => Estimate uncertainty of mFFWI with Gaussian Error Propagation (GEP) principles
Suitability of WRF for fire risk assessment • Simulation length matters • Mean FFWI and mFFWI obtained by WRF at the 4 observational sites are the same as for observations • Errors between (m)FFWI derived from WRF and observations are within the range of observational uncertainty • RMSE are lower for mFFWI than FFWI • Determination of (m)FFWI more difficult in mountainous than relatively flat terrain • Means of (m)FFWI derivded from WRF and observations do not differ significantly (95% confidence) according to a t-test, but variance does according to f-test • WRF is suitable for fire weather forecast
Acknowledgements We thank • Edward O'Lenic and the organizing team for inviting us • Zhao Li, Debasish Pai Mazumder, Ted Fathauer for collaboration • You for your attention
Released aerosols and trace gases reduce air quality Courtesy: J. Connor
Fires, smoke, and burn scars in Alaska and Yukon Territory in August 2005 2005/08/10 2210 UT (false color) Aqua http://rapidfire.sci.gsfc.nasa.gov/gallery/?search=alaska&date
Large fire scars increase of upward transport and development of a non-classical mesoscale circulation 0500 AST 1100 AST 2100 AST 1400 AST From Mölders & Kramm 2006
Cloud formation changes due to wildfire scars 0500 AST 1100 AST 2100 AST 1400 AST From Mölders & Kramm 2006