Download
1 / 16
160 likes | 168 Views
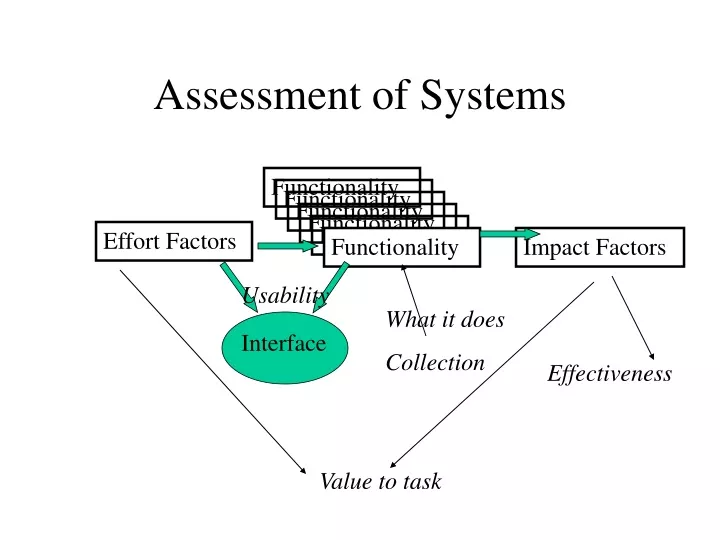
Interface. Assessment of Systems. Functionality. Functionality. Functionality. Functionality. Functionality. Effort Factors. Functionality. Impact Factors. Usability. What it does Collection. Effectiveness. Value to task. What is a “task”. Generally -- a family of related problems

E N D
Interface Assessment of Systems Functionality Functionality Functionality Functionality Functionality Effort Factors Functionality Impact Factors Usability What it does Collection Effectiveness Value to task
What is a “task” • Generally -- a family of related problems • generally a group of users • possibly a specific organization • VALUE • to the individuals (e.g. One physician) • to the organization (e.g her hospital) • to the larger goals (e.g. A hospital serves health to the patients and the community)
What is a task • COST • to an individual (the physician’s time; money) • to an organization (system; building, maintenance; organizational costs -- learning; training; disruption of established patterns) • to the larger or ultimate unit ( the patient; the community). • These costs and values produce at least 3 separate decision models. (More if we cross layers).
3 Layers of assessment • Individual. Benefit vs Effort. Is it larger with system (method) A than B? May not be enough to decide. Perhaps A gives more benefit, and takes more time: A B Slope is benefit:cost ratio
Why benefit, and even cost/benefit is not enough • Organization may not be able to spend this much time on each patient. Now if A delivers nothing until you have spent the time, then you can not afford it unless you are willing to skip some cases completely. • This decision has to be made already at the individual user level. But user may be willing to skip some (hand off).
Multiple levels • But organization has no way to cover the excess. So may mandate use of faster, poorer, lower benefit/cost system. • Other stakeholders (patient, society) may not value the cases in the same way. • Patient: put me (my child, etc.) ahead of others • Society: change organization model to remove constraint.
“Learning Curve” • Power of a system increases with experience and knowledge. Often high costs at start up. Money, time, and human factors.
Estimating system quality • Case study method -- system in use for a particular major project. Attempt to estimate contribution of system to success of project. Not a quantitative measure. Interviews, judgements, what-if scenarios. • Statistical, sampling method. Find small examples of the key task. Assess system performance on each one. Report mean and variation.
Mean and Variation • Requires a numerical (interval or ratio scale) measure. Examples: time to completion; number of good documents recovered; precision ratios, recall ratios; user error rates; ... • Use standard techniques (e.g. A spreadsheet) to estimate average and amount of variation.
Put it all together • Assemble representative (similar) tasks • Gather interview qualitative information about the process; affective aspects; goals • Agree upon a few measures of performance that relate to those goals. • Measure the performance on a large enough set of similar tasks.
Reporting out the results • Report and interpret the summary statistics. • (p-values; sampling effects;) • example: (interpretation 3) “there is less than 0.7% chance that the two sets of times are produced by systems whose performance is actually the same. Difference is in both the mean and the variation or standard deviation” • Report and interpret the study as a whole. (cont.)
Reporting (2) • Case 1. The mean is what matters: Clearly system (B) is better, taking almost a full minute less on every single task (suppose these are measured in minutes).
Reporting (3) • Case 2. The uniformity is what matters. System B is not acceptable because there is so much variation in how long it takes, and we cannot accept + a full hour (suppose measured in hours) for this information problem. If we know how long it takes, we can plan. But we can’t handle variation. So the faster system here is not better.
Reporting (4) • Compare performance to cost. If the systems have same costs, we can stop with the preceding. If they are different we need to look at the Performance-Cost plot, and discuss the importance of the two aspects. • Consider the reality of change, for the individuals, and for the organization. Seek methods to enhance training, ownership and “buy-in”.
Reporting (5) • Recognize that systems in an organization are no longer static. They are changes that are part of a larger change process. Be sensitive to the issues in managing change. Do not focus too narrowly on the technical aspects of the system. • Do not focus too broadly, assuming that technical aspects make no difference.