Download
1 / 31
310 likes | 311 Views
Learn about the challenges of aviation emissions and the industry's commitment to reducing CO2. Explore strategies, targets, and the role of governments in promoting sustainable biofuels.

E N D
A Global Framework For Addressing Aviation CO2 Emissions Paul Steele Director Aviation Environment IATA
Aviation is a key driver of socio-economic development • 2.2 Billion passengers • 32 Million jobs • 8% of global GDP (US$ 3.5 trillion) • 2% of global man-made CO2 emissions • Major driver of tourism and trade
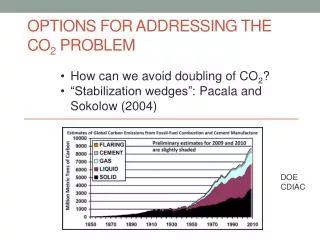
Aviation faces emissions challenge…… 1600 Pre-recession ICAO forecast 1400 CO2 emissions from the global fuel burn of commercial airlines Post-recession 1200 IATAforecast 1000 800 Million tonnes CO2 600 628 Mt (2010F) 400 200 0 2029 1990 1993 1996 1999 2002 2005 2008 2011 2014 2017 2020 2023 2026 Source: IATA
70 1200 Emissions at 65 1100 Fuel efficiency frozen 1990 technology 60 1000 55 900 million tonnes 3.3 Billion tonnes of Fuel efficiency, litres/100 TKP 50 800 CO2 saved 2 CO 45 700 CO 2 40 600 Actual Emissions 35 500 30 400 1990 1993 1996 1999 2002 2005 2008 2011 2014 2017 2020 …..but our track record is strong
Our four-pillar strategy: • Invest in new technology • Fly more efficiently • Build and use efficient infrastructure • Use effective economic measures
Global industry targets 2010 2020 2050 1.5% p/a fuel efficiency Working towards CNG CNG from 2020 Implementation of global sectoral approach 50% reduction in net CO2 emissions over 2005 levels
C CO2 Abatement cost curve in 2020 CO Marginal Abatement Cost Curve in 2020 2 for global commercial airline fuel burn USD/tCO 1,000 2 Jet fuel price; 800 100 $/barrel 600 200 Carbon price 65 US$/tCO 0 MtCO2 2 0 5 10 15 20 25 30 35 40 45 50 55 60 65 70 75 80 85 90 95 100 105 110 115 120 125 130 135 140 145 150 - 200 - 400 - 600 - 800 European ATM Improvements Next Gen Wingtips Biofuels Early retirement - Re engining Gulf region Cabin weight reductions Engine retrofit/upgrades No tankering Airspace China redesign Use of ground power Reduced speed operation with current fleet Flexible tracks North Pacific Takeoff and Landing Procedures PRD Center of Gravity Flexible Usage of Military airspace Pilot Technique Drag reduction Fuel Management Taxiing with some engines shut down Optimizing cost index RVSM Russia Source: IATA Carbon Model
CNG 2020 Emissions reduction roadmap No action CO2 emissions “Frozen technology” emissions Gross emissions trajectory -50% by 2050 (schematic) 2050 2010 2005 2020 2030 2040
CNG 2020 Emissions reduction roadmap “Frozen technology” emissions Known technology, operations and infrastructure measures Carbon-neutral growth 2020 Gross emissions trajectory No action CO2 emissions Tech Ops Infra -50% by 2050 (schematic) 2050 2010 2005 2020 2030 2040
Emissions reduction roadmap “Frozen technology” emissions Known technology, operations and infrastructure measures Biofuels and additional technology Carbon-neutral growth 2020 Gross emissions trajectory Economic measures No action CO2 emissions Tech Ops Infra Biofuels + add. Tech CNG 2020 -50% by 2050 (schematic) 2050 2010 2005 2020 2030 2040
2010 to 2020 2010 2020 2050 1.5% p/a fuel efficiency Working towards CNG CNG from 2020 Implementation of global sectoral approach 50% reduction in net CO2 emissions over 2005 levels
2010–2020: +1.5% p.a. fuel efficiency CO2 from commercial airline fuel burn 1100 Frozen technology at 2010 fuel efficiency 1000 728 million tonnes of additional cuts required by 2020 to make + 1.5% paefficiency target 900 800 million tonnes 700 2 CO 600 150 million tonnes of cuts needed in 2020 CO 2 500 400 1990 1993 1996 1999 2002 2005 2008 2011 2014 2017 2020 Source: IATA Carbon Model
Key emissions reduction drivers to 2020 Fleet renewal Infrastructure Operations Biofuels Industry can deliver on fleet/ load factor and operations Governments need to support infrastructure and biofuels Alternative Fuels Infrastructure Retrofits Operations Load Factor Fleet Renewal Analysis: Key conclusions 13 Govt. support needed 12 1 11 16 Industry driven measures 47 % Emissions reduction potential to 2020 Source: IATA Carbon Model
How can governments help? • Invest in ATM improvements – e.g. NextGen and SESAR • Invest in R&D funding for new technology • Promote scaling up and of sustainable biofuel production
Our biggest opportunity is sustainable biofuels Second & third generation biofuels - e.g. camelina, algae With the potential to reduce our carbon footprint by up to 80% Full certification by Q1 2011 Next step: scaling up and commercialisation
Biofuels could completely replace Jet A-1 100% High 90% Central (high) 80% 70% Central (low) 60% Low Proportion of jet demand 50% Very low 40% 30% 20% 10% 0% 2005 2010 2015 2020 2025 2030 2035 2040 2045 2050 Source: E4tech
Promotion of aviation biofuelsGovernments have their part to play too R&D funding Pilot projects Fiscal & investment incentives Transport & energy policy
Emissions reduction roadmap “Frozen technology” emissions Known technology, operations and infrastructure measures Biofuels and additional technology Carbon-neutral growth 2020 Gross emissions trajectory Economic measures No action CO2 emissions Tech Ops Infra Biofuels + add. Tech CNG 2020 -50% by 2050 (schematic) 2050 2010 2005 2020 2030 2040
Market-based measures Industry recognises that MBMs will be needed to “close the gap” But we need positivenot punitive measures Fiscal/financial/policy measures to: Accelerate R&D Incentivize technical/operational improvements Promote alternative fuels Emissions trading can play a role but must be global Industry offset mechanisms should also be recognized
How can governments help? By agreeing • A coordinated policy approach • A global framework under ICAO By avoiding • A fragmented policy approach • Unilateral use of national/regional measures
“Green” taxes $1.2bn $3.5bn $0.2bn $100m $25bn? $ ? $ ? $ ? Uncoordinated patchwork Emissions trading $ ? $ ? $ ? $ ? $ 1-13 bn $ 4 mn
Concerns with Environment Taxes • “Green” taxes do nothing for the environment • Money goes into central treasury funds • Netherlands tax repealed after 18% shift in traffic across borders • Distance banding causes market distortions • UK APD distortions because based on capital cities • Cheaper to fly to Hawaii than Bermuda • Taxes hurt developing country trade and tourism • Usually distant from tourism source and trade target markets
The ICAO 37th Assembly was a unique opportunity for governments to agree on a global framework…
ICAO 37th Assembly Resolution Positives: • First ever global sectoral agreement to reduce carbon emissions • Reflects aspirational industry goal of carbon-neutral growth from 2020 • Lists 15 principles for MBMs, in line with industry priorities, e.g. • Transparency and simplicity • No duplication • Minimize leakage and distortion • Appropriate access to all carbon markets
Aviation’s economic impact • If aviation were a country, it would rank 21st in terms of GDP –same size as Switzerland • 35% of goods transported worldwide – by value – are sent by air, but only 5% by volume • 40% of international tourists travel by air • Air travel supports 1.3% of total employment in Africa, contributing $10 billion to GDP and is 4 times as productive as the economy as a whole • In Latin America, 1.8 million jobs are supported by aviation, contributing $22 billion to the GDP
The food miles debate • High-value, perishable foods • Supporting emerging economies • Air-freighted fresh produce to the UK alone supports 1.5 million jobs in Africa • ‘Food miles’ argument doesn’t stand up – Oxfam report • You must look at the full lifecycle and most produce grown in Europe requires large amounts of energy • Lincoln University study showed 1kg of New Zealand lamb shipped to the UK had a smaller carbon footprint than 1kg of British lamb
IATA carbon offset program • 17 Airlines – 6% of global traffic • TAP Air Portugal won UNESCO “Planet Earth Award” in 2010. • Large credible offset provider sources high quality carbon credits. • Carbon credits are compliance grade CERs (under CDM/Kyoto Protocol) • Offering passengers a portfolio of offset projects • large geographical coverage • social and economic benefits for local communities. • IATA Carbon Calculator • ICAO methodology • enhanced with real airline data. • Government approved offset program (DECC-UK QA) • Phase II of the program has started – corporate travel/online agents.
Carbon labelling • Flybe first airline to label planes • Noise • Fuel Consumption • CO2 emissions • New CO2 standard • Being developed by ICAO and industry • Standard for new aircraft types • Ready in 2013
A global framework for addressing aviation CO2 emissions Q & A?