Download
1 / 26
260 likes | 268 Views
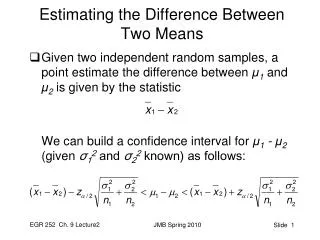
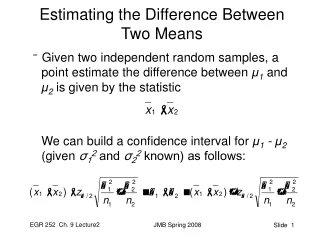
Difference between two groups Two-sample t test. April 3, 2000. Two-sample t test. Sometimes, we want to compare two different groups or samples to see if their means are different. Did one class score higher on an exam than another?

E N D
Difference between two groupsTwo-sample t test April 3, 2000
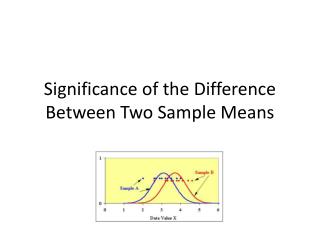
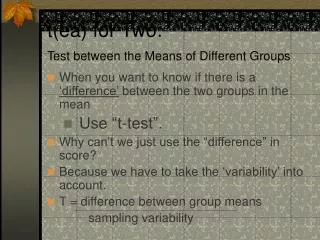
Two-sample t test • Sometimes, we want to compare two different groups or samples to see if their means are different. • Did one class score higher on an exam than another? • Is the average GRE score of MPA students different than the average GRE score of MPH students? • Are the welfare to work rates higher for residents in Mon County (who has a day-care program) than those in Preston County (who does not).
Two-sample t test • The procedure for this statistic is very similar to a simple t test. The primary difference is that you must compute a standard error for each of the two groups. • There are different formulas for this test depending on whether or not the samples are independent of one another and whether or not they have equal variances. We will work with one type: independent samples, unequal variances. • Again, somewhat different process/formula than that shown in book.
Two-sample t test • For a sample of 30 female professors, the mean salary is $41,000 with a st dev of $3,000. (group 1) • For a sample of 50 male professors, the mean salary is $41,800 with a st dev of $3,400. (group 2) • Is the mean salary of men higher than the mean salary of women?
Two-sample t test • Two formulas needed
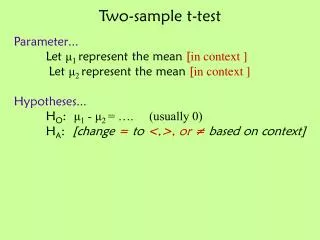
Two-sample t test • H1: The average salary of male professors is higher than the average salary of female professors. • H0:There is no difference in the average salary of male and female professors. • Select an alpha level. • = .05
Two-sample t test • Group 1 • Group 2
Two-sample t test • So, t = 1.02 (ignore the minus sign) • Find tcr (one-tailed test) • = .05 • df = 78 (n1 + n2 - 2) • tcr = 1.66 • Since t < tcr we fail to reject the null hypothesis. The mean salary of female professors is not statistically significantly different than the mean salary of male professors.
Two-sample t test • Practice problem
Correlation • Correlation examines the relationship between two variables. • The relationship can be expressed as a graph called a scattergram.
Correlation • The relationship between the two variables can also be expressed as a number called the correlation coefficient. • one of many statistics referred to as measures of association. • The values of correlation coefficients range from -1 to +1. • The most commonly used measure of correlation is the Pearson product-moment correlation coefficient, designated as “r”.
Correlation • The correlation coefficient signifies two things. • The direction of the relationship (positive or negative) • The strength or magnitude of the relationship (strong, moderate, weak, etc.)
Correlation • A positive correlation indicates that high values of one variable correspond with high values of the other variable and low values correspond with low values. When this occurs, the r value is a positive number (r=.66) • A negative correlation indicates that when the value for one variable is high the value for the other variable will be low. When this occurs, the r value is a negative number (r=-.66)
Correlation • A correlation coefficient of -1 or +1 represents a perfect correlation. • r = -1 is a perfect negative relationship • r = +1 is a perfect positive relationship • A correlation of 0 (r = 0) means that no linear relationship exists between the two variables. • The stronger the relationship between the two variables, the closer r is to 1.
Correlation • r = 0.82 • There is a strong positive relationship. As female literacy increases in a country, female life expectancy also increases.
Correlation • R = - 0.84 • There is a strong negative relationship. As female literacy in a country increases, infant mortality decreases.
Correlation • r = 0.37 • There is a moderate, positive relationship between birth rate and death rate for a country.
Correlation Coefficient • Suppose we are looking at the relationship between two variables: weight of a package of apples and price. If the scale is accurate, it looks like this.
Correlation Coefficient • There is a positive perfect relationship between the two variables. r= 1.0
Correlation Coefficient r= .96 • Suppose the scale was a little off. Now the line might look like this. 12 10 8 6 4 2 WEIGHT 0 0 20 40 60 80 100 120 140 PRICE
Correlation Coefficient • Now there is not a perfect relationship. The r does not equal 1.0 • Now, r - .96
Pearson’s r • Practice problem
Correlation • Web site: Guessing correlations