Download
1 / 12
180 likes | 768 Views
9.2 Testing the Difference Between Two Means: Using the t Test. Test 9 Thursday March 21. This the last day the class meets before spring break starts. Please make sure to be present for the test or make appropriate arrangements to take the test before leaving for spring break.

E N D
9.2 Testing the Difference Between Two Means: Using the t Test Bluman, Chapter 9
Test 9 Thursday March 21 This the last day the class meets before spring break starts. Please make sure to be present for the test or make appropriate arrangements to take the test before leaving for spring break Bluman, Chapter 9
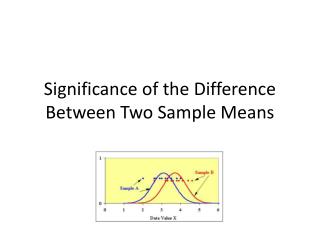
9.2 Testing the Difference Between Two Means: Using the t Test Formula for the t test for comparing two means from independent populations with unequal variances where the degrees of freedom are equal to the smaller of n1 – 1 or n2 – 1. Bluman, Chapter 9
Testing the Difference Between Two Means: Using the t Test • There is a different formula for the t test for comparing two means from independent populations with equal variances. To determine whether two sample variances are equal, the researcher can use an F test. • Note, however, that not all statisticians are in agreement about using the F test before using the t test. Some believe that conducting the F and t tests at the same level of significance will change the overall level of significance of the t test. Their reasons are beyond the scope of this textbook. Because of this, we will assume that 12in this textbook. Bluman, Chapter 9
Chapter 9Testing the Difference Between Two Means, Two Proportions, and Two Variances Section 9-2 Example 9-4 Page #485 Bluman, Chapter 9
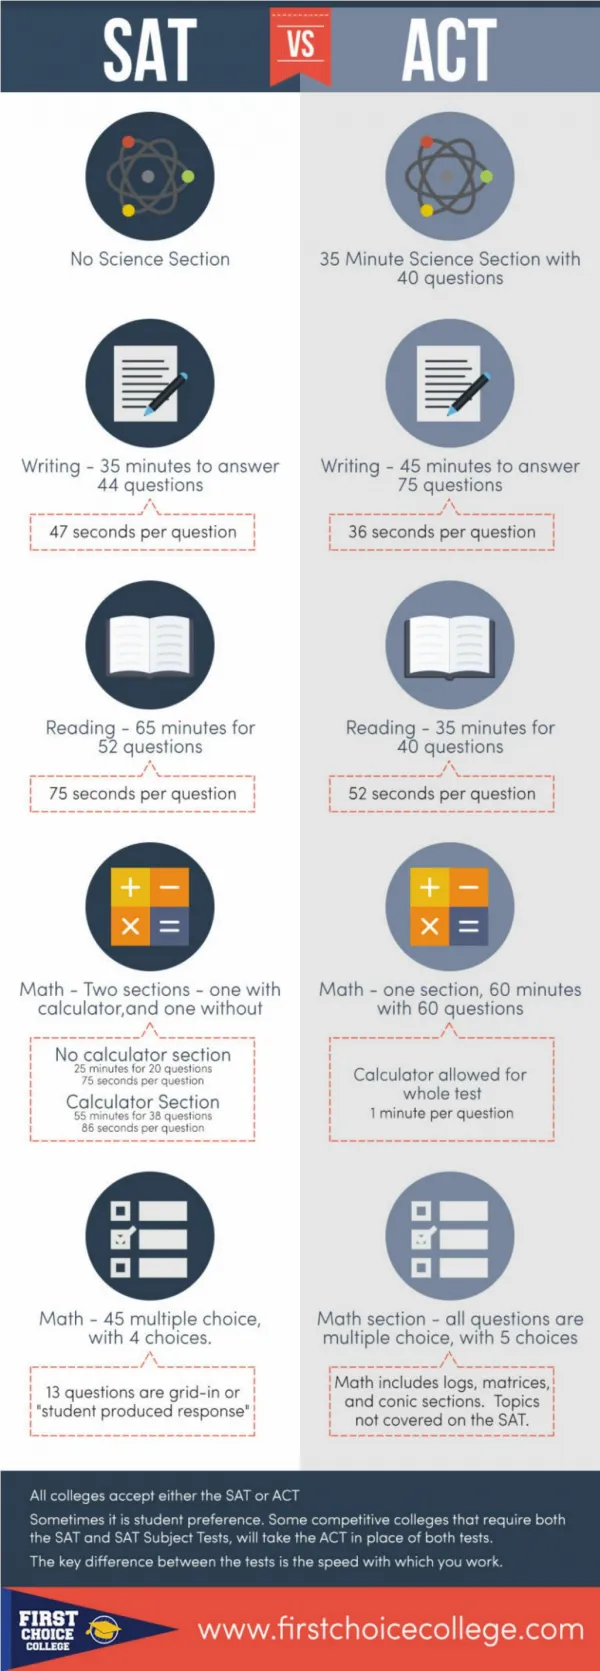
Example 9-4: Farm Sizes The average size of a farm in Indiana County, Pennsylvania, is 191 acres. The average size of a farm in Greene County, Pennsylvania, is 199 acres. Assume the data were obtained from two samples with standard deviations of 38 and 12 acres, respectively, and sample sizes of 8 and 10, respectively. Can it be concluded at α = 0.05 that the average size of the farms in the two counties is different? Assume the populations are normally distributed. Step 1: State the hypotheses and identify the claim. H0:μ1 = μ2 andH1:μ1μ2(claim) Bluman, Chapter 9
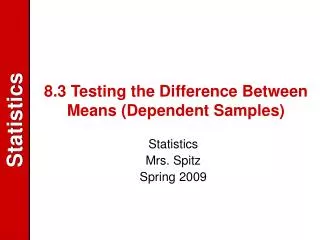
Example 9-4: Farm Sizes Step 2: Find the critical values. Since the test is two-tailed, a = 0.05, and the variances are unequal, the degrees of freedom are the smaller of n1 – 1 or n2 – 1. In this case, the degrees of freedom are 8 – 1 = 7. Hence, from Table F, the critical values are -2.365 and 2.365. Step 3: Find the test value. Bluman, Chapter 9
Example 9-4: Farm Sizes Step 4: Make the decision. Do not reject the null hypothesis. Step 5: Summarize the results. There is not enough evidence to support the claim that the average size of the farms is different. Bluman, Chapter 9
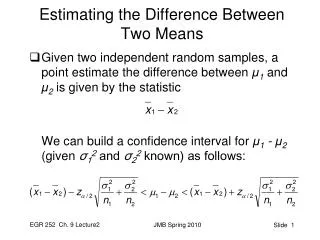
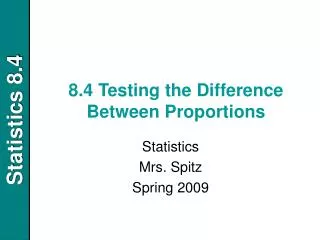
Confidence Intervals for the Difference Between Two Means Formula for the t confidence interval for the difference between two means from independent populations with unequal variances d.f. smaller value of n1 – 1 or n2 – 1. Bluman, Chapter 9
Chapter 9Testing the Difference Between Two Means, Two Proportions, and Two Variances Section 9-2 Example 9-5 Page #478 Bluman, Chapter 9
Example 9-5: Confidence Intervals Find the 95% confidence interval for the difference between the means for the data in Example 9–4. Bluman, Chapter 9
On your own • Study the examples in section 9.2 • Sec 9.2 page 487 • #1, 5, 11, 15, 17 Bluman, Chapter 9