Download
1 / 31
310 likes | 316 Views
Experience from construction and operation of the first Vertex Detector based on MAPS. LBNL Leo Greiner , Eric Anderssen, Giacomo Contin, Thorsten Stezelberger, Joe Silber, Xiangming Sun, Michal Szelezniak, Chinh Vu, Howard Wieman, Sam Woodmansee UT at Austin Jerry Hoffman, Jo Schambach

E N D
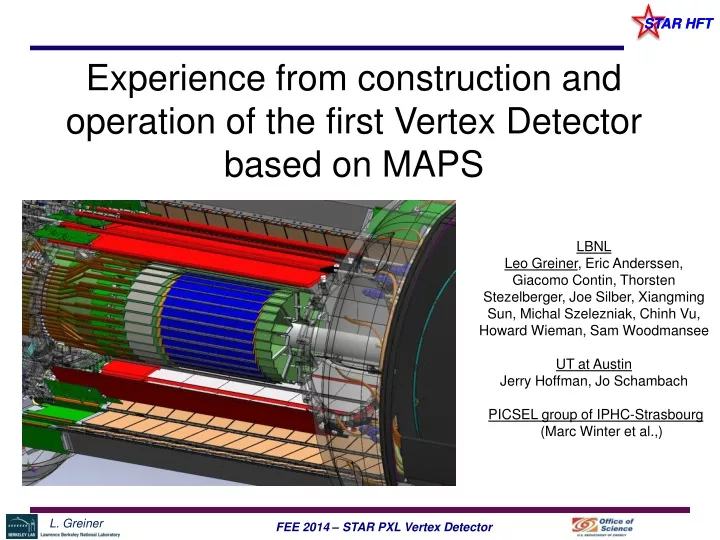
Experience from construction and operation of the first Vertex Detector based on MAPS LBNL Leo Greiner, Eric Anderssen, Giacomo Contin, Thorsten Stezelberger, Joe Silber, Xiangming Sun, Michal Szelezniak, Chinh Vu, Howard Wieman, Sam Woodmansee UT at Austin Jerry Hoffman, Jo Schambach PICSEL group of IPHC-Strasbourg (Marc Winter et al.,)
Talk Outline • STAR vertex detector upgrades at RHIC. • Pixel detector design and characteristics. • Sensors and mechanics. • Detector assembly and integration with lessons learned. • Installation for 2014 run and first results. • Lessons learned and outlook.
PXL in STAR Inner Detector Upgrades TPC – Time Projection Chamber (main tracking detector in STAR) HFT – Heavy Flavor Tracker • SSD – Silicon Strip Detector • r = 22 cm • IST – Inner Silicon Tracker • r = 14 cm • PXL – Pixel Detector • r = 2.8, 8 cm Direct topological reconstruction of Charm We track inward from the TPC with graded resolution: vertex ~1mm ~300µm ~250µm <30µm TPC SSD IST PXL
Aluminum conductor Ladder Flex Cable PXL Detector Design Mechanical support with kinematic mounts (insertion side) carbon fiber sector tubes (~ 200 µm thick) Insertion from one side 2 layers 5 sectors / half (10 sectors total) 4 ladders/sector Ladder with 10 MAPS sensors (approx. 2×2 cm each) 20 cm
PXL Detector Basic Unit (RDO) 11 m (24 AWG TP) 2 m (42 AWG TP) Mass Termination Board (signal buffering) + latch-up protected power Clk, config, data, power Clk, config, data PXL Sector RDO motherboard w/ Xilinx Virtex-6 FPGA 100 m (fiber optic) RDO PC with fiber link to RDO board PXL built events • Highly parallel system • 4 ladders per sector • 1 Mass Termination Board (MTB) per sector • 1 RDO board per sector • 10 RDO boards in the PXL system Trigger, Slow control, Configuration, etc. Existing STAR infrastructure
Detector Design Characteristics 356 M pixels on ~0.16 m2 of Silicon * Simple geometric component, cluster centriod fitting gives factor of ~1.7 better.
PXL detector Ultimate-2 Sensor • Reticle size (~ 4 cm²) • Pixel pitch 20.7 μm • 928 x 960 array ~890 k pixels • Power dissipation ~170 mW/cm² @ 3.3V (air cooling) • Short integration time 185.6 μs • In pixel CDS • Discriminators at the end of each column (each row processed in parallel) • 2 LVDS data outputs @ 160 MHz • Zero suppression and run length encoding on rows with up to 9 hits/row. • Ping-pong memory for frame readout (~1500 hits deep) • 4 sub-arrays to help with process variation • JTAG configuration of many internal parameters. • Individual discriminator disable, etc. • Built in automated testing routines for sensor probe testing and characterization. • High Res Si option – significantly increases S/N and radiation tolerance. • Sensors thinned to 50 µm. Optimized for the STAR environment Developed by PICSEL group of IPHC-Strasbourg
PXL Ladder Assembly • Precision vacuum chuck fixtures to position sensors by hand. • Sensors are positioned with butted edges. Acrylic adhesive prevents CTE difference based damage. • Weights taken at all assembly steps to track material and as QA. Hybrid cable with carbon fiber stiffener plate on back in position to glue on sensors. • Sensor positioning • Cable reference holes for assembly • FR-4 Handler Assembled ladder
Sector and detector half assembly • Sectors • Ladders are glued on carbon fiber sector tubes in 4 steps • Pixel positions on sector are measured and related to tooling balls • After touch probe measurements, sectors are tested electrically for damage from metrology Metrology picture Sector assembly fixture A detector half Sector in the metrology setup • Detector half • Sectors are mounted in dovetail slots on detector half • Metrology is done to relate sector tooling balls to each other and to kinematic mounts Detector half mapped
Yields Production is still ongoing.
PXL insertion Yes – we push it in by hand PXL has a unique mechanical design. The PXL detector is inserted along rails and locks into a kinematic mount on the insertion end of the detector. This allows for rapid (1 day) replacement with a characterized spare detector. • Mechanics Insertion of PXL detector Kinematic mounts
Detector Installation PXL assembled in the STAR clean room • Pxl installation pics • Clean room • Installed and cabled PXL inserted into the STAR TPC inner field cage, cabled and operational. Total installation time = 2 days.
Lessons learned during construction and installation Things that worked well and things that didn’t • Sensors • Build testing functionality into the sensor design from the start optimized for probe testing/module testing. We developed the parametric testing requirements first and implemented them in the design with IPHC. • Readout • Co-develop the RDO with the sensor. It is then guaranteed to work and you have time to find and fix incompatibilities and quirks. • Probe testing • Proper probe pin design for curved thinned sensors. • Spend time on whole probe system yield (ours varied between 46% - 60%). • Administrative control of sensor ID worked well for us. • Engineering run • Do a proper full system test (if possible) in the correct environment with partial full detector and infrastructure. • We discovered mechanical problems even in a fully solid modeled system (interferences, kinematic mount insertion, etc.). • Assembly • Spend time optimizing full yield through all production steps. Original ladder and sector yields were much lower until all the problems were worked out. • Acrylic adhesive works well as a CTE stress decoupling method.
Cosmic Ray Running • PXL was installed with all sensors (400) working. < 2k bad pixels out of 356M. • All pixel positions on each detector half were mapped in CMM prior to installation. • PXL RDO and integration with STAR DAQ, trigger, etc. complete and working well. • Automated threshold setting scripts applied (1600 thresholds need to be set). Noise rate is ~1-2 x 10⁻⁶ per sensor for most of the sensors. Last few sensors were tuned manually. • All parameters are stable and preliminary alignment with cosmic ray tracks was made. • Some misalignment in the kinematic mounts (~1mm). • Sensor positions on detector halves appear to be as measured in the CMM before installation.
PXL preliminary half-to-half pointing residuals Inner layer Preliminary Preliminary Preliminary Outer layer Preliminary Preliminary Preliminary Consistent with expectations for alignment and momentum of muons. Preliminary alignment by Alex Schmah
15 GeV/c and 200 GeV/c running - status Jan 25 Feb 14 Mar 14 May 21 Jul 7 End of run 200 GeV start 15 GeV start PXL install now • The HFT (PXL + IST) was used only intermittently in the 15 GeV/c Au+Au run. • The HFT (PXL + IST) has been operated in the 200 GeV/c Au+Au since the start. • The SSD is still commissioning and is expected to join the data taking in some weeks. • We have 700M events stored and are on track to take >1G events in this run. This should meet the physics requirements. Projection of current data rate to end of run
Preliminary DCA Pointing resolution TPC + IST + PXL Preliminary 750 MeV Kaon 750 MeV Kaon CD-4 requirement Simulation with Al Cable 200 GeV/c Au-Au data * Alignment still not complete
Lessons learned from operation • Perform full LU/rad environment testing of thinned production sensors/modules for all expected conditions. • Sensors were being damaged in radiation field. We have lost ~15/400 sensors. • Damage apparently halted by limiting the energy available to a latch-up event (set LU current thresholds to ~120mA over the ladder running current). • This is still under investigation. We will be performing additional LU testing in the near future with thinned production sensors. • Have backup solutions – e.g. Cu rather than Al conductor cables • Our aluminum conductor flex PCBs had problems during fabrication and, due to late delivery, only 2 ladders with aluminum conductor were installed in the first run of the detector. • Implement as much remote configuration of sensor/module and detector operating parameters as possible to allow for remediation of surprises. • We implemented remote setting of ladder LU thresholds, voltage supplied to the ladders, voltage read, current read after first engineering run tests. • This allowed us to diagnose and stop the damage described above.
outlook • The PXL detector at STAR was installed for the 2014 Au-Au run. • The detector system appears to operate as designed, integration with STAR infrastructure is complete. • The DCA pointing resolution performance of the installed HFT detectors appears to be as expected. • Sensor damage related to the radiation field was observed. The damage appears to be able to be halted by using operational methods. Based on our observations, we should hopefully be able to prevent damage to the next installed detector. • We expect to be able to deploy the spare detector (with Al conductor cable on the inner ladders) for the next run and repair the damage to the existing detector with the spare ladders being fabricated. • At this point, it appears that the installed PXL detector will be able to complete the physics goals for this run. • The spare detector should be ready in ~1 month. • MAPS appear to be working well as a technology for vertex detectors.
Possible Mechanisms • Non-ionizing (Neutron) damage? – Dislocation of atoms in the matrix generally results in permanent damage to silicon. This is consistent with what we observe. In discussions with Matt Durham who worked on the Phenix FVTX detector, he indicated that the beam tune into Phenix had some component of scraping against a magnet or beam pipe surface that caused spallation neutron based damage in their detector and that the neutron rate was nearly 3 orders of magnitude above what was calculated. In our case, we have no information about the neutron flux at low radii from the beamline. • Ionizing radiation damage? – The primary source of ionizing radiation damage is expected to come from the transit of MIPs through the sensors. This is expected to show up in hits registered in sensor pixels. The occupancy of charged tracks is approximately what was projected in the simulations ( ~300 hits per frame on the inner ladders and ~100 hits per frame in the outer ladders). The likelihood of normal beam activities causing the damage observed is judged to be low. There have been, however, a significant number of non-standard events during this run. Particularly during the 15 GeV run period. • LU related damage? – It is possible that LU events could cause damage in the silicon. This would need to be a phenomenon particular to thinned silicon and/or high resistivity epi. We did extensive testing of full thickness sensors at the BASE facility at the 88” cyclotron at LBNL where we exposed sensors to many thousands of LU events to measure the LU LET onset and cross-section.
NOW Amps Digital current on the inner ladders Before operational optimizations Amps
Proposed Testing Plan Proton Irradiation The testing done for ionizing radiation dose was done with gamma rays. This is a generally accepted method of assessing the radiation tolerance of silicon designs. The proton irradiation more closely mimics the environment at the operating STAR experiment and adds displacement damage to the mix. We propose to expose an existing powered PXL ladder to proton beams at the 88” cyclotron at LBNL at various rates up to 300 kRadas well as testing the latch-up cross section due to proton irradiation (if possible, the primary proton LU mechanism of energy deposition from recoil only turns on at ~100 MeV). Latch-up Testing It is possible that the damage observed is related to latch-up. The fact that the sensors are now thinned to 50um could give opportunity for other failure mechanisms such as micro-fracturing due to higher LU point temperature excursions. We propose to expose an existing PXL ladder and thinned sensor on testing cards to heavy ion beams at the 88” Cyclotron BASE facility for up to 5k latch-up events on a sensor. We will also measure the voltage discharge profile on the ladder to understand the profile of energy deposition in the silicon LU area. The production sensors have high resistivity epi and the initial LU test sensors were standard epi. Neutron Irradiation It is possible that we are being exposed to a much higher neutron flux than has been anticipated. We propose to irradiate some sensors to doses of 1013, 1014 and 1015 1MeV Neq / cm2 . These sensors have already been sent to Sandia for irradiation with a batch of ATLAS sensors.
Run 15090063 - Mon Mar 31 21:16:0 Sector 10 L1 = 1.57 A L2 = 0.78 A L3 = 0.78 A L4 = 0.78 A
Ladder assembly work flow chart Electrically tested driver boards Dimensionally checked compositebacker Probe tested sensors Electrically tested low mass cables Ladder assembly • Ladder characterization • Reworking and troubleshooting • Quality assessment • Initial validation Ladder wire bonding 1 day without problems Full functionality test Wire bond encapsulation • Full functionality test • bias optimization • Threshold scan • Normal readout mode test • Accidental hit rate scan Quick test Complete ladder • Quick test • Threshold scan @ nominal bias settings
Sector/half-detector work flow chart machined Dovetail/D-tube Elect tested MTB/cables/insertion Tested Ladders Sized Sector Tubes Sector assembly Quick test Sector metrology Quick test Half detector head assembly Half detector head metrology Full Half detector assembly Quick test Full functionality test ½ HFT PXL
Ladder Design Ladder cable concept
Radiation length in low mass area Si 50um (0.0529%) 0.0677% acrylic 50um (0.0148%) Encapsulant + bond wires (0.070%) Capacitors + solder (0.0035%) 0.128% Coverlay (0.0075%) Al 30um – both sides (0.0248%) kapton 50um (0.0148%) Coverlay (0.0075%) acrylic 50um (0.0148%) 0.0441% Carbon composite 125um (0.0293%) Si adhesive 100 um (0.0469%) from older estimate 0.1486% Carbon composite 250um (0.1017%) Total = 0.388% NOTE: Does not include sector tube side walls
PXL insertion mechanics Interaction point view of the PXL insertion rails and kinematic mount points Carbon fiber rails Kinematic mounts
Assembling sensors into ladders – Probe Testing Yield modeling makes probe testing critical to the goal of assembling functional 10 sensor ladders. We test thinned and diced 50 µm thick sensors (curved). This is not easy. • Probe card with readout electronics • derived from individual sensor test card • Analog and digital sensor readout • Full speed readout at 160 MHz • Full sensor characterization at full speed • Test results used for initial settings in ladder testing and PXL detector configuration • 2nd generation probe card for production testing • only digital readout pins loaded