Download
1 / 17
170 likes | 373 Views
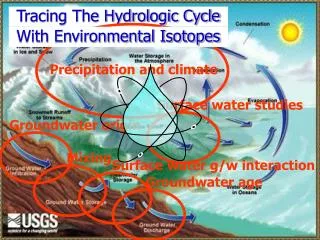
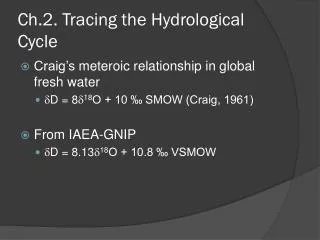
Ch.2. Tracing the Hydrological Cycle. Craig’s meteroic relationship in global fresh water d D = 8 d 18 O + 10 ‰ SMOW (Craig, 1961) From IAEA-GNIP d D = 8.13 d 18 O + 10.8 ‰ VSMOW. Partitioning of isotopes through the hydrological cycle Isotopic composition of ocean waters

E N D
Ch.2. Tracing the Hydrological Cycle • Craig’s meteroic relationship in global fresh water • dD = 8d18O + 10 ‰ SMOW (Craig, 1961) • From IAEA-GNIP • dD = 8.13d18O + 10.8 ‰ VSMOW
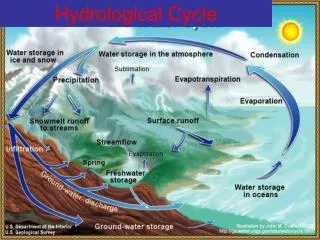
Partitioning of isotopes through the hydrological cycle • Isotopic composition of ocean waters • The early oceans were isotopically depleted and warmer than today gradually enriched through Proterozoic and Phanerozoic time by exchange with isotopically enriched crustal rocks • The isotopic composition varies with • Salinity (evaporation) • Dilution by runoff • Ice melting (glacier retreat) etc. • See Fig. 2-2 & 2-3 on p.38.
The atmosphere & vapour mass formation • The troposphere contains more than 90% mass (very little vapour circulates to the stratosphere) • The greatest supply (>70%) of vapor to the troposphere is from evaporation over the warm subtropical seas (Fig. 2-4 on p. 39)
From http://www.engineeringtoolbox.com/moisture-holding-capacity-air-d_281.html
Isotopic equilibrium in water-vapor exchange • For an equlibrium evaporation at 25oC, d18Ov=d18Ow + e18Ov-w=0 + (-9.3)=-9.3 ‰ dDv=dDw + eDv-w=0 + (-76)=-76 ‰ See Fig. 2-5 on p.40.
Humidity & kinetic evaporation Fig. 2-2 Enrichment of 18O and 2H in distilled water during evaporation of water under controlled conditions. Humidity h is 0% and temperature is 25°C. As the fraction of water remaining approaches 0, a Rayleigh distillation causes an exponential increase in the heavy isotopes. Under conditions of increasing humidity, exchange with the vapour phase reduces the exponential enrichment. Under conditions of high humidity, a steady state value is reached due to complete exchange with the vapour mass.
Model for nonequilibrium evaporation over a water body. Arrows indicate relative fluxes of water between the mixed water column and the boundary layer, and between the boundary layer and the well mixed air column. Differences in the rate of diffusion of 18O to 16O and 2H to 1H impart a "kinetic" isotope depletion in the overlying air column.
The maximum kinetic enrichment that this diffusive effect can impart is calculated from our formula for diffusive fractionation of a gas in air (Chapter 1). In this case it is calculated for 18O in H2Ov from the boundary layer (bl) to the vapour reservoir of the open air water vapour (v): Using the molecular mass of H218O (20), H216O (18), and air (mair = 28.8 for 79% N2 and 21% O2), gives De18Obl-v = 1.0323. De18Obl-v = (a18Obl-v – 1) · 103 = 32.3‰ Similarly, 2H in the water vapour would be depleted by a maximum of: DeDbl-v = (aDbl-v – 1) · 103 = 16.6‰
Kinetic effects in terms of humidity (Gonfiantini, 1986) • De18Obl-v = 14.2 (1–h) ‰ • DeDbl-v = 12.5 (1–h) ‰ • The total fractionation between the water column and the open air is then the sum of the fractionation factor for equilibrium water-vapour exchange (el-v) and the kinetic factor (Debl-v) • d18Ol – d18Ov = e18Ol-v + De18Obl-v
Isotopic enrichment in evaporating water and the effect of humidity. Slopes are approximations of early portion of each curve near the GMWL (heavy line) (modified from Gonfiantini, 1986
Deuterium excess “d” in meteoric water See Fig, 2-9. & 2-10 on p. 44 Dansgard (1964): d= dD-8d18O See Fig. 2-11 & Table 2-6. on p. 45
Atmospheric mixing and global atmospheric water vapor • Craig & Gorden (1965): mean isotopic composition of global precipitation • d18O=-4‰ , dD=-22‰