Download
1 / 64
640 likes | 825 Views
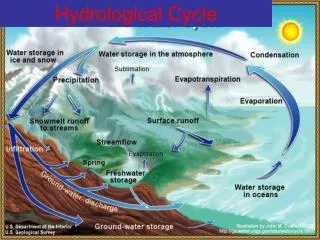
The Global Hydrological Cycle Task 1. Further condensation causes rainfall. C. B. With altitude vapour starts to cool & condense forming clouds. Some rain is intercepted by trees and rises back to the atmosphere due to evapo-transpiration. F. A.

E N D
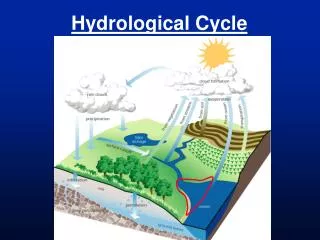
Further condensation causes rainfall C B With altitude vapour starts to cool & condense forming clouds Some rain is intercepted by trees and rises back to the atmosphere due to evapo-transpiration F A Some water is temporarily stored in lakes or as ice Some rain infiltrates through soil and rock Some rain travels as stream channel flow back to the seas Sun evaporates sea water which rises as warm vapour G E D Some water underground returns to rivers or the seas as ground flow H
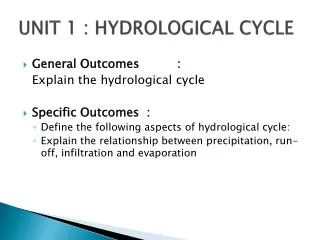
Drainage Basins Task 2a
A c B A is the source B is the mouth C is the drainage basin
Drainage Basins Task 2c
Input Output Of Water Vapour Precipitation Transpiration Evaporation Vegetation (interception Storage) River Channel Ground Surface Overland Flow Infiltration Surface Store Soil Store Through Flow Percolation Ground Water Store Ground Flow SEA
Describing And Explaining Hydrographs
Hydrograph Graph showing River Discharge against rainfall over a period of time at a particular point along the river. Storm Hydrographs Show the change in discharge caused by a period of rainfall
Why Construct & Analyse Hydrographs ? • To find out what river discharge • patterns of a particular drainage • basin are like • To help predict flooding & so • influence flood prevention measures
Describing The Parts Of Storm (flood) Hydrographs
Flood Hydrograph Basin lag time Peak flow 3 Rising limb Overland flow Recession limb 2 mm Discharge (m3/s) 4 Through flow 1 3 2 Base flow 0 12 24 36 48 60 72 Hours from start of rain storm
3 2 Discharge (m3/s) 1 0 12 24 36 48 60 72 Hours from start of rain storm The amount of water passing though the river in cubic metres/second (m3/s) or cumecs
Rainfall shown in mm, as a bar graph 3 2 mm Discharge (m3/s) 4 1 3 2 0 12 24 36 48 60 72 Hours from start of rain storm
Discharge in m3/s, as a line graph 3 2 mm Discharge (m3/s) 4 1 3 2 0 12 24 36 48 60 72 Hours from start of rain storm
Rising limb The rising flood water in the river, if steep rapid increase in discharge 3 Rising limb 2 mm Discharge (m3/s) 4 1 3 2 0 12 24 36 48 60 72 Hours from start of rain storm
Peak flow Peak flow Maximum discharge in the river 3 Rising limb 2 mm Discharge (m3/s) 4 1 3 2 0 12 24 36 48 60 72 Hours from start of rain storm
Recession limb Peak flow Falling flood water in the river, angle shows rate discharge drops 3 Rising limb Recession limb 2 mm Discharge (m3/s) 4 1 3 2 0 12 24 36 48 60 72 Hours from start of rain storm
Basin lag time Basin lag time Peak flow The time difference between peak rainfall and the peak river flow 3 Rising limb Recession limb 2 mm Discharge (m3/s) 4 1 3 2 0 12 24 36 48 60 72 Hours from start of rain storm
Base flow Basin lag time Peak flow Normal discharge of the river 3 Rising limb Recession limb 2 mm Discharge (m3/s) 4 1 3 2 Base flow 0 12 24 36 48 60 72 Hours from start of rain storm
Overland flow Basin lag time + Peak flow Through flow 3 = Rising limb Storm Flow the amount of water flowing in or above ground due to the rain Overland flow Recession limb 2 mm Discharge (m3/s) 4 Through flow 1 3 2 Base flow 0 12 24 36 48 60 72 Hours from start of rain storm
Overland flow Through flow Volume of water reaching the river through the soil and underlying rock layers Volume of water reaching the river from surface run off
Describing A Storm Hydrographs Overland flow Through flow Base flow You need to refer to: Basin lag time Peak flow 3 Rising limb • Rainfall (mm) 2 Recession limb mm • Rising Limb Discharge (m3/s) 4 1 3 • Peak Flow & Base Flow 2 • Recession Limb 0 12 24 36 48 60 72 • Lag time Hours from start of rain storm • Recovery rate, back to Base flow • Note any fluctuations
Basin lag time Peak flow 3 Rising limb Overland flow Recession limb 2 mm Discharge (m3/s) 4 Through flow 1 3 2 Base flow 0 12 24 36 48 60 72 Hours from start of rain storm Now describe the hydrograph we have been looking at.
Following, are some theoretical factors influencing the shape of the graph BUT………… When interpreting hydrographs all factors must be considered together !
Factors Influencing Storm Hydrographs • Area • Shape • Slope • Rock Type • Soil • Land Use • Drainage Density • Precipitation / Temp
Area Large basins receive more precipitation than small basins therefore have higher runoff and so a higher peak flow Larger size means longer lag time as water has a longer distance to travel to reach the trunk of the river Area Rock Type Drainage Density Shape Soil Precipitation / Temp Slope Land Use
Shape Elongated basin will produce a lower peak flow and longer lag time than a circular one of the same size Improve Explanation Area Rock Type Drainage Density Shape Soil Precipitation / Temp Slope Land Use
Steep slope also means faster runoff Gentle slope also means slower runoff Slope Channel flow can be faster down a steep slope therefore giving a steeper rising limb and shorter lag time Area Rock Type Drainage Density Shape Soil Precipitation / Temp Slope Land Use
Joints Allowing Water To Infiltrate In Permeable Rock No Joints So Water Can’t Infiltrate An Impermeable Rock Rock Type Permeable rocks mean rapid infiltration and little overland flow therefore a gentler rising limb Area Rock Type Drainage Density Shape Soil Precipitation / Temp Slope Land Use
Soil Infiltration is generally greater on thick soil, though clay soils act as impermeable layers reducing infiltration The more infiltration occurs the longer the lag time and gentler the rising limb Area Rock Type Drainage Density Shape Soil Precipitation / Temp Slope Land Use
Land Use Urbanisation - concrete and tarmac form impermeable surfaces increasing runoff, creating a steep rising limb and shorter lag time Afforestation - intercepts the precipitation, reducing run off & so creating a gentler rising limb and longer lag time. Through flow is also reduced as stemflow means water is taken in by plants/trees reducing peakdischarge Area Rock Type Drainage Density Shape Soil Precipitation / Temp Slope Land Use
Drainage Density A higher density will allow rapid overland flow allow and there will be more water so a higher peak discharge with a steeper rising limb. Area Rock Type Drainage Density Shape Soil Precipitation / Temp Slope Land Use
Precipitation & Temperature Short intense rainstorms can produce rapid overland flow and steep rising limb If there have been extreme temperatures, the ground can be hard (either baked or frozen) causing rapid surface run off Snow on the ground can act as a store producing a long lag time and shallow rising limb. Once a thaw sets in the rising limb will become steep Area Rock Type Drainage Density Shape Soil Precipitation / Temp Slope Land Use
Remember these influencing factors will: Influence each other Change throughout the rivers course
Complete the explanations for the Flood Hydrograph using the words below. drains ~ joints ~ concrete ~ rising ~ lag ~ stem steep ~ thick ~ peak ~ longer ~ store ~ infiltration infiltrates ~ trees ~ intense ~ overland ~ hotter
River Processes Task 5 Profiles
Which course has V – shaped valleys/ waterfalls/ meanders/ ox-bow lakes/ floodplains Which course has the steepest slope? Which course has the most erosion? Which course has the fastest flow? Upper Course Middle Course Lower Course Steep Slope Moderate Slope Gentle Slope Fast Flow Moderate Flow Slow Flow Erosion Transportation Deposition transportation deposition transportation V-shaped Valley Small Meander Large Meander Waterfall Small Floodplain Large Floodplain Gorge Ox-Bow Lake
River Landforms Task 6a V-Shaped Valleys
4 The eroded material that falls into the river is then transported downstream by the river and is deposited on its bed or on a river beach. 3 As the rock & soil from the river bank breaks up, it is transported to the river by to gravity and the wash effect of rain on the soil. 1 As the river flows it erodes downwards initially, due to the great energy it has. This happens mainly because of the process of corrasion (explain in detail for in exam!) 2 The river therefore forms a deep and steep sided channel. Over time freeze thaw (again explain) weathering acts upon the riverbank. This loosens the rock and soil.
2 1 3 4 1 As the river flows it erodes downwards initially, due to the great energy it has. This happens mainly because of the process of abrasion (explain in detail for in exam!) 2 The river therefore forms a deep and steep sided channel. Over time freeze thaw (again explain) weathering acts upon the riverbank. This loosens the rock and soil. 3 As the rock & soil from the river bank breaks up, it is transported into the river itself. This happens due to gravity and the wash effect of rain on the soil. 4 The eroded material that falls into the river is then transported downstream by the river and is deposited on its bed or on a river beach.
Swirling Plunge Pool Hard Rock Soft Rock Erosion Corrasion Retreat Repetition
Task 6b Listen Write Waterfall (Sequence) • Paragraph 1 • Upper course • River – hard rock to soft rock • Rocks different hardness erode different rates • Soft erodes quickly hard slowly • Soft downstream hard rock upstream • Explain erosion for marks • Differential erosion • Paragraph 2 • Soft rock erodes - steep section - waterfall • Base – plunge pool develops • Water swirls rocks in pool – soft erodes back further • Hard rock undercut – overhangs – collapses • Process repeats moving upstream • Paragraph 3 • Stage retreat • Narrow – steep sided valley - gorge
River Landforms Task 7 Meanders
Pool River Beach Riffle River Cliff Now sequence an answer explaining this process water ~ river ~ flows ~ pool to riffles ~ pool ~ deep slow ~ riffle ~ shallow fast causes ~ movement ~ water ~ side ~ side ~ development ~ meander
Inner Bend Outer Bend Slow Flow – Low Energy Fast Slow – High Energy Small Rocks Large Rocks Deposition - Sediment Erosion - Corrasion Shallower Channel Deeper Channel Builds Up Bank Undercuts Bank River Beach River Cliff
New straighter course of river Old meander cut off from river Ox-bow Lakes
Oxbow Lakes Meanders eroding and depositing across floodplain Direction River Flows
Meanders erode towards each other leaving a narrow neck of land between them
River breaks through neck during spate/flood eroding a new channel Island created between original meander & new channel