Download
1 / 38
380 likes | 429 Views
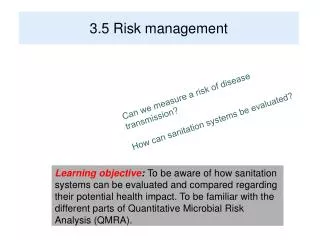
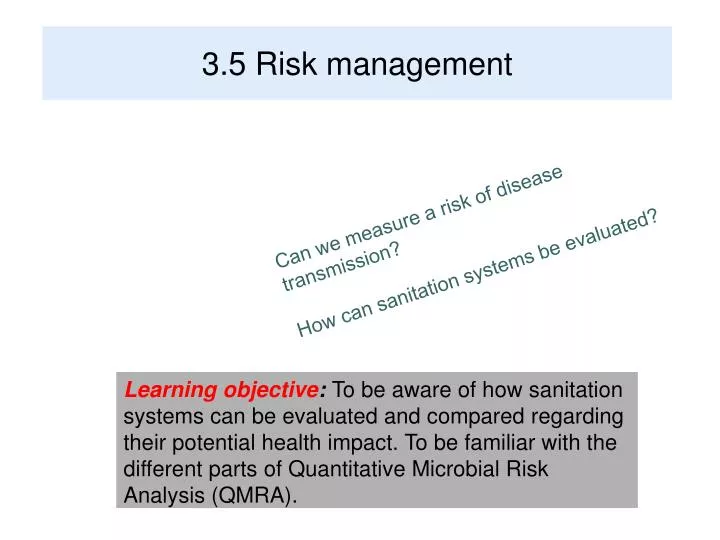
3.5 Risk management. Can we measure a risk of disease transmission? How can sanitation systems be evaluated?.

E N D
3.5 Risk management Can we measure a risk of disease transmission? How can sanitation systems be evaluated? Learning objective: To be aware of how sanitation systems can be evaluated and compared regarding their potential health impact. To be familiar with the different parts of Quantitative Microbial Risk Analysis (QMRA).
Risk management – policy development Theory, basic research DisseminationCommunicationEducation
Treatment as a healthprotectionmeasure • The most important barrier to manage risks? • Handling (contact) of excreta should be minimized, but necessary to some extent • What is practically, socially and culturally acceptable? • Adapted to local conditions, education and information, sustainability • Treatment recommendations important part of the guidelines • Will develop, on-going research
WHO’s multiple barrier approach from “Farm to Fork” Wastewater generation Wastewater generation Wastewater generation Farmer/ Producer Consumer Consumer Traders/Retailers Street food kitchens Consumer Safe irrigationpractices Hygienichandlingpractices Safe food washing and preparation Wastewater treatment Wastewater treatment Wastewater treatment Awareness creation to create demand for safe produce Safe produce Safe produce … … Policy recognition, safer farm land, tenure security, market incentives, safe-food labelling,… Risk reduction strategies
Examples of how to design regulations • Treatment • define processes, • different levels (categories) • Validation of the treatment process • Microbiological/hygienic quality • presence of microorganisms, • reduction of microorganisms • Restrictions on usage • Fertilising (irrigation) methods • Handling of the product (e.g. transport, storage) • Protection of workers • Sampling • Analytical methods
Diverted Small volumes Easier to treat Suitable fertiliser products Handling requires restrictions Mixed (conventional) Large volumes of ”hazardous” waste Extensive treatment Reuse products: wastewater, sludge Downstream pollution Comparison of sanitation systems
Assessment of health risks • Microbial analysis • Indicators not always reliable • Epidemiological studies • Scarce, complex • Microbial risk assessment • The main approach (?)
Microbial Risk Analysis • Risk Assessment • Qualitative or quantitative • Systematic procedure • Acceptable risks • Risk Management • To handle the risks • Aims at reducing risks • Risk Communication • Essential part in all systems • Necessary for awareness raising and health protection • Involve ”all” stakeholders
Quantitative Microbial Risk Assessment (QMRA) • Hazard Identification • All enteric pathogens potentially in excreta • Exposure assessment • Exposure points, site-specific data on removal • Literature data on occurrence of pathogens, removal in treatment and survival in environment • Exposure scenarios evaluated (ingestion, volumes) • Dose-response assessment • Published mathematical models • Risk characterisation • Risk of infection per exposure and yearly, DALYs • Comparison with endemic level of disease (underreporting)
Microbial risk assessment – urine (outline) • Faecal contamination • Faecal sterols analysed • What amounts of pathogens would the faecal contamination contribute? • Incidence in the population (statistical data) • Faeces could contribute enteric pathogens to the urine • IF they end up in the urine – will they survive storage? • Survival studies performed and literature data used for crop • How can people be exposed to the urine? • Scenarios determined • What dose could they be exposed to? • Amounts ingested estimated (Höglund et al., 2002)
Microbial risk assessment – urine (outline) • Input: faecal contamination, prevalence of infection,excretion densities, excretion days, inactivation rates • Scenarios: • Dose-response models • Output: probability of infection (Höglund et al., 2002)
Risk from accidental ingestion of 1 ml unstored urine • Unstored urine Pinf < 1:1000 except for rotavirus • Storage for six months at 20°C all risks < 1:1000 (Höglund et al., 2002)
Risk from accidental ingestion of 100 g crop • Inactivation will continue in the field • Risk dependent on time between fertilising and consumption (Höglund et al., 2002)
Microbial risk assessment - faeces • Faeces from dry urine diverting latrines in Denmark • No additives • Treatment by storage • Hazard identification • Bacteria: Salmonella, EHEC • Viruses: rotavirus, hepatitis A • Protozoa: Giardia, Cryptosporidium • Helminth: Ascaris • Compiled studies (literature) for pathogen survival • Incidence (surveillance), excretion numbers and times (duration) also input for calculation of doses • Model organisms – dose-response relation • Exposure when handling and using in garden (Schönning et al., 2004)
Exposure scenarios • The faeces-soil intake (Larsen,1998) - children around 200 mg of soil (max of 5-10 g). • Assumed that adults ingest 15-50% of this amount, with a maximum of 100 mg. • The container emptied once a year assuming only adults exposed. • The number of exposures through recreation was a median value of 3.5 times per week (during June-August). • 50% of the households were exposed through gardening once a week (during May-September). • It was assumed that one exposure corresponded to two hours of gardening occurring a maximum two times per day. (Schönning et al., 2004)
Conclusions - pathogens • There is an “unacceptably” high (>1:10 000) risk of infection when faeces is used without treatment • The highest risk from exposure to unstored material was attributable to rotavirus • 12 monthsstorage – sufficientreduction of mostpathogens (compared to a risk level 1:10 000) • The highest risk from exposure to stored faeces was attributable to Ascaris • the protozoa Giardia and Cryptosporidium are of greater concern in the European population • The risks of infection can be reduced by simple measures such as longer storage, or treatment with a pH elevating compound (Schönning et al., 2004)
Risk for infection when emptying container Ascaris Salmonella Examples of how risk for infection are presented as probabilitydensityfunctions. The typical risk equals the 50th-percentile and worst case equals the 95th-percentile. (Schönning et al., 2004)
Microbial risk assessment – wastewater and sludge • Hässleholm municipality with 28 600 residents • 12 500 m3 wastewater per day • Wastewater treatment: pre-aeration, pre-sedimentation, activated sludge, chemical precipitation, three-media filter • Sludge treatment: anaerobic digestion, dewatering, outdoor storage • Sludge use: Application to vegetables (theoretical) (Westrell et al., 2004)
Microbial risk assessment – wastewater and sludge • Hazard Identification • All entero-pathogens potentially in wastewater • EnterohaemmorhagicE.coli (EHEC), Salmonella, Giardia, Cryptosporidium, rotavirus and adenovirus • Exposure assessment • Exposure points identified together with WWTP staff • Site-specific data on removal of indicators in WWT • Literature data on occurrence of pathogens in ww, removal in sludge treatment and survival in environment • Dose-response assessment • Published dose-response models • Risk characterisation • Monte Carlo simulations • Risk of infection per exposure • Yearly number of infections in study population • Comparison with endemic level of disease (epidemiological statistics adjusted for underreporting and morbidity rates) (Westrell et al., 2004)
3, 4 2 1 5 Exposure scenarios – wastewater treatment 8 7 6 (Westrell et al., 2004)
Exposure scenarios – wastewater treatment (Westrell et al., 2004)
Risk of infection per exposure All risks >10-4 are shown in orange (Westrell et al., 2004)
Number of yearly infections (Westrell et al., 2004)
Severity of hazards (Westrell et al., 2004)
Classification of exposures (Westrell et al., 2004)
Exposure 1 Easy to control with Personal Protective Equipment (PPE) Covering of basins Exposure 2 Easy to control with PPE Optimisation of sludge treatment (baffles against short-circuiting, thermophilic digestion etc.) Control measures (Westrell et al., 2004)
Exposure 6 Fence storage area Optimisation of sludge treatment Exposure 7 Use of PPE Optimisation of sludge treatment Prolonged sludge storage Control measures • Exposure 8 • Crop restrictions • Minimum time between fertilisation and harvest • Optimisation of sludge treatment • Prolonged sludge storage (Westrell et al., 2004)
Worst-case situation 2002 • Per-Åke Nilsson and staff at Hässleholm wastewater treatment plant • Swedish research council FORMAS • MISTRA Urban Water program Acknowledgements (Westrell et al., 2004)
Epidemiologicalstudy - El Salvador • 107 households, 449 people • Prevalence of parasitic infections • Type of latrines • UD solar desiccating latrine (single vault) • UD double-vault desiccating latrine (LASF) • Pit latrines • No latrines • UD = urine diverting (Corrales et al., 2006)
Prevalence of parasitic infections • Use of UD-latrines (both solar and LASF) – lowerprevalence of the less environmentally persistent pathogens (hookworm, Giardia, Entamoeba) • Use of LASF – higherprevalence of moreenvironmentallypersistent pathogens(Ascaris, Trichuris) (Corrales et al., 2006)
Summarised results • LASF (this design) does not achieve conditions needed to inactivate these organisms • UD solar latrines – lower prevalence of most parasites compared with LASF and pit-latrine • Use of ”biosolids” (faecal matter) in agriculture – higher prevalence of infections compared to burying the material (Corrales et al., 2006)
Conclusions • In El Salvador, the solar latrine is recommended • Includes urine diversion • Better results than pit latrine • High prevalence of some infections in diverting latrines identifes the need for • Further work on better designs • Better use and maintenance, information • Further evaluation under different local environments and cultures • Limitations of the study • Different communities compared • Small sample size
Epidemiological study South Africa • Peri-urban area, eThekwiniMunicipality, Durban • 1337 households incl. in study • Intervention • Sanitation – dry UD-toilets • Safe water (200 L per day) • Health and hygiene education • Purpose and method • Measure reduction in diarrhoea associated with the interventions • Prospective cohort study • Disease incidence questionnaire (6 visits) Picture provided by Teddy Gounden (Knight et al., manuscript)
Type of Sanitation Intervention in Sample Area Exposed Area (N=660) Unexposed Area (N=667) Provided by Renuka Lutchminarayan
Epidemiological study South Africa - Results • 41% reduction in diarrhoea • Benefits 3 times greater for children <5 years • Fewer acute water related health outcomes • Duration of diarrhoea episodes decreased (54% fewer days reported) • Not possible to disaggregate the effect of each separate intervention Picture provided by Teddy Gounden (Knight et al., manuscript)
Incidence Rate & Incidence Rate Ratio of Diarrhoea Episodes by Gender & Total IRR: 0.50 IRR: 0.65 IRR: 0.58 (Knight SE, Esterhuizen T, Lutchminarayan R, Stenström T-A)
Impacts on diarrhoeal disease reduction by interventions (In WHO, 2008, adapted from Fewtrell et al., 2005)
Summary of module on risk management • Different types of studies • Possible to investigate the ”real” situation? • Epidemiology – underestimation in disease incidence • Interviews, surveillance • Risk assessments – assumptions made, over- or underestimating risks (?) • Sampling and microbial analysis • Illustrates the importance of various studies • Range of interventions possible and needed in combination • Difficult to differentiate effects • Identifying need of risk management and barriers • Health protection measures of different kinds