Download
1 / 46
460 likes | 495 Views
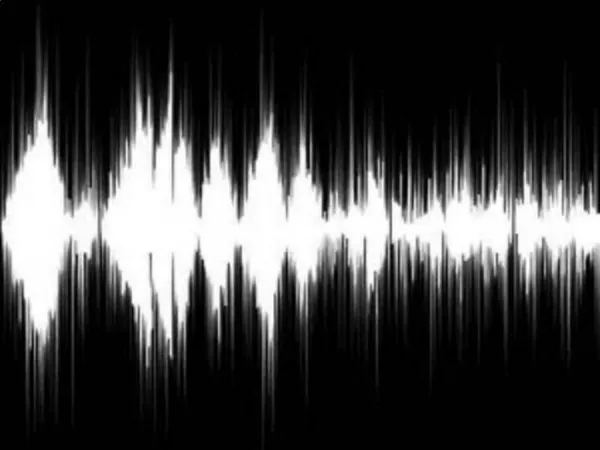
What is Sound?. Sound is the movement of energy through substances in longitudinal (compression/rarefaction) waves.

E N D
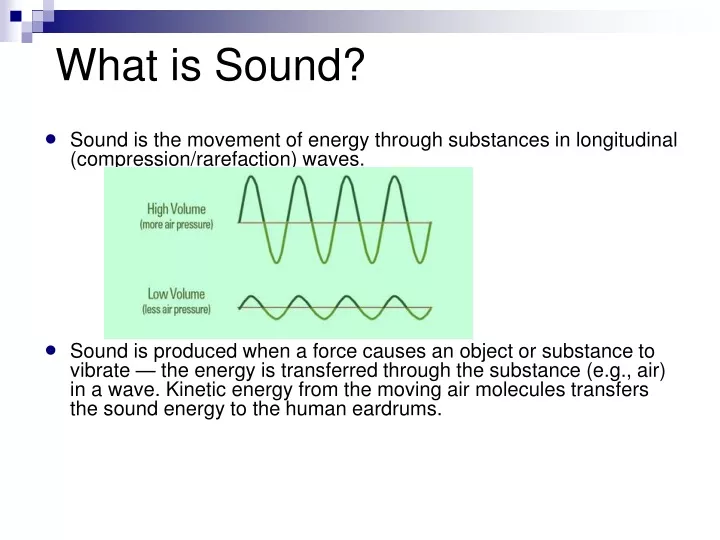
What is Sound? • Sound is the movement of energy through substances in longitudinal (compression/rarefaction) waves. • Sound is produced when a force causes an object or substance to vibrate — the energy is transferred through the substance (e.g., air) in a wave. Kinetic energy from the moving air molecules transfers the sound energy to the human eardrums.
Metrics Used with Sound • Sound energy is usually measured by its pressure and intensity, in special units called decibels. • Sometimes, loud noise can cause pain to people. This is called the threshold of pain. This threshold is different from person to person.
Sound Intensity: Decibell • The decibel measures sound pressure or electrical pressure (voltage) levels. It is a logarithmic unit that describes a ratio of two intensities, such as two different sound pressures, two different voltages, and so on. A bel is a base-ten logarithm of the ratio between two signals. • Logarithms map exponential values to a linear scale. For example, by taking the base-ten logarithm of 10 and 1,000,000,000, this large range of numbers can be written as 1–9, which is a much more convenient scale.
Frequency • The 250–4000 Hz frequency band, where humans hear best, is described as midrange. High-frequency energy beyond the midrange is called treble, and this adds crispness or brilliance to a sound.
Timbre (Spatial Form of Sound) • Timbre: sounds are made up of many different frequency components vibrating at the same time. The resulting characteristics of a sound are the result of the unique combination of frequencies it contains. • Timbre-> Colour or quality of a sound
Timbre (Spatial Form of Sound) • Pitch is expressed using musical notes, such as C, E flat, and F #. The pitch is only the lowest, strongest part of the sound wave, called the fundamental frequency. • Every musical sound also has higher, softer parts called overtones, partials, or harmonics, which occur at regular multiples of the fundamental frequency. • The human ear doesn’t hear the harmonics as distinct pitches, but rather as the tone color (the timbre) of the sound, which allows the ear to distinguish one instrument or voice from another, even when both are playing the same pitch.
Spectrum of Four Waveforms 1) sine wave has energy only at one frequency. 2) Triangle wave has energy at odd multiples of the fundamental with the energy of each harmonic decreasing as 1 over the square of the harmonic number (1/N2) 3) sawtooth wave decrease in energy in proportion to the inverse of the harmonic number (1/N) 4) Pulse (or rectangle or square) waveforms have energy over a broad area of the spectrum
Pahsors • A phasor is essentially a way of representing a sinusoidal function. • any sound can be represented as a combination of phase-shifted, amplitude-modulated tones of differing frequencies. • That is, that any sound can be represented as a sum of sinusoids. This sum is called a Fourier series.
Adding two sinusoids of the same frequency • Adding a sine and cosine of the same frequency gives a phase-shifted sine of the same frequency: • The Aplitude of the sum C is • The phase shift is given by the angle whose tangent is equal to A/B.
Periodic Signals • Any periodic function of period 1 can be written as follows: These sums are called Fourier coefficients, which make up a set of numbers called the spectrum of the sound
Frequency Components • The values of An and Bn for "small" values of n make up the low-frequency information, and we call these the low-order Fourier coefficients. • The big values of n index the high-frequencycomponents. • Since most sounds are made up of a lot of low-frequency coponents, the low-frequency Fourier coefficients have larger absolute value than the high-frequency Fourier coefficients.
Fourier synthesis • Fourier synthesis is the inverse of Fourier decomposion, where we take varying amounts of a bunch of sine waves and add them together (i.e.,play them at the same time) to reconstruct a sound. • This process of analyzing or synthesizing a sound based on its sine wave- components is called a Fourier transform on the sound. • We use Fast Fourier transform (or FFT) for analysis (decomposion) and the inverse FFT (IFFT) for synthesis.
Frequency Components of the sum of sinewaves hundreds or even thousands of sine waves are needed to accurately build up a complex waveform. The complex waveform is composed of a collection of independent sine waves.
Discrete Fourier Taransform (DFT) • DFT changes an N point input signal into two point output signals. • The input signal contains the signal being decomposed, • The two output signals contain the amplitudes of the component sine and cosine waves • The input signal is in the time domain • The output signal in the frequency domain
Time Domain & Frequecy Domain • Time domain in Fourier analysisrefers to samples taken over time, or it might be a general reference to any discrete signal that is being decomposed. • Frequency domain is used to describe the amplitudes of the sine and cosine waves (including the special scaling factor for these). • The process of calculating the frequency domain is called decomposition, analysis, the forward DFT, or simply, the DFT. • Calculation of the time domain is called synthesis, or the inverse DFT. Both synthesis and analysis can be represented in equation form and computer algorithms.
The DFT Data Format • N point time domain signal is contained in x[n]. • The frequency domain of this signal consists of two parts, each an array of N/2 +1 samples,which are: • the Real part written as:ReX[ ]. The values in ReX[ ] are the amplitudes of the cosine waves • the Imaginary part of X[ ], written as: ImX[ ]. The values in ImX[ ] are the amplitudes of the sine waves
An example DFT with N = 128 • The time domain signal is given in an array: x[0] to x[127] . • The frequency domain signals are stored in two arrays: ReX[0] to ReX[64], and ImX[0] to ImX[64]. • Notice that 128 points in the time domain corresponds to 65points in each of the frequency domain signals, with the frequency indeces running from 0 to 64.
Frequency Domain Representation • The horizontal axis of the frequency domain can be referred to in four different ways: • The horizontal axis is labeled from 0 to 64, corresponding to the 0 to N/2 samples in the arrays. The index here is an integer, e.g., ReX[k] and ImX[k], where k runs from 0 to N/2 in steps of one,i.e., Cosine index: k: c[n] = cos(2πkn/N)
Frequency Domain Representation • The horizontal axis is labeled as a fraction of the sampling rate. This means that the values along the horizonal axis always run between 0 and 0.5, since discrete data can only contain frequencies between DC and one-half the sampling rate. • The index used with this notation isf, for frequency. The real and imaginary parts are written: ReX[f] and ImX[f], whereftakes on N/2+1 equally spaced values between 0 and 0.5. Cosine index: f: c[n] = cos(2πfn)
Frequency Domain Representation • The third style is similar to the second, except the horizontal axis is multiplied by 2π. The index used with this labeling is ω. • the real and imaginary parts are written: ReX[ω] and ImX[ω], where ω takes on N/2 + 1 equally spaced values between 0 and π. The parameter, ω, is called the natural frequency, and has the units of radians. Cosine index: ω: c[n] = cos(ωn)
Frequency Domain Representation • The fourth method is to label the horizontal axis in terms of the analog frequencies. For instance, if the system has a sampling rate of 10 kHz (i.e., 10,000 samples per second), graphs of the frequency domain would run from 0 to 5 kHz. This method has the advantage of presenting the frequency data in terms of a real world meaning. • Indeces for the four types: • krunning from 0 to N/2; • f running from 0 to 0.5; • ω running from 0 to π; • frequency expressed in hertz, running from DC to one-half of an actual sampling rate (Nyquist low!).
DFT Basis Functions • The sine and cosine waves used in the DFT are commonly called the DFT basis functions. That is, the output of the DFT is a set of numbers that represent amplitudes. The basis functions are a set of sine and cosine waves with unity amplitude. The DFT basis functions are generated from the equations:
Example of 32 point DFT the cosine wave c0[ ]. This is a cosine wave of zero frequency.ReX[0] holds the average value of all the points in the time domain signal. s0[ ] is the sine wave of zero frequency. c2[ ] & s2[ ] are the sinusoids that complete two cycles in the N points. These correspond to ReX[2] & ImX[2], respectively
Example of 32 point DFT c10[ ] & s10[ ] are the sinusoids that complete ten cycles in the N points.These sinusoids correspond to the amplitudes held in ReX[10] & ImX[10].c16[ ] & s16[ ]containthe highest frequencies in the basis functions
Synthesis, Calculating the Inverse DFT • Putting together everything said so far, we can write the synthesis equation: That is, N point signal, x[i], can be created by adding N/2 + 1 cosine and N/2 + 1 sine waves. The amplitudes of the cosine and sine waves are held in the arrays ImX[k] and ReX[k], respectively. The synthesis equation multiplies these amplitudes by the basis functions to create a set of scaled sine and cosine waves. Adding the scaled sine and cosine waves produces the time domain signal, x[i].
The phase vocoder • A phase vocoder represents an ensemble of techniques which take a sound in the time domain,calculate the Fourier transform, perform some manipulations in frequency domain and then reconstruct the sound in time domain.
Analysis/synthesis steps INPUT ANALYSIS TRANSFORMATIONS SYNTHESIS OUTPUT
STFT • Time-domain audio signal is separated into successive short frames. • Each frame is multiplied by a window function to smooth transitions. • Resulting windows are passed on to FFT module. The FFT process then extracts spectral information on the signal.
Spectral transformations • Pitch shifting • Time stretching • Morphing (Cross-synthesis)
Pitch shifting • How would you perform a pitch shift in time domain? • What are the drawbacks of doing it?
Solution: move to frequency domain • In frequency domain • 1) Calculate the spectrum • 2) Shift it upwards or downwards • 3) Go back to time domain
Time stretching • Time-scaling is an application that allows signal length to be stretched or shortened without affecting the frequencies of its components. • 1) Calculate spectrum • 2)Reduce/increase time information • 3) Go back to time domain
Morphing • It is the combination of two signals • In frequency domain: • 1) Calculate spectrum of signal A • 2) Calculate spectrum of signal B • 3) C = A B
STFT resynthesis • STFT resynthesis is the final stage of the phase vocoder process. It is based on recreating a signal in time domain from the modified spectral components of the input signal.
STFT analysis The third stage implements an exact inverse of the process that was used in STFT analysis of the signal. Modified spectral components of the input signal are passed through the Inverse Fourier Transform to recreate a set of time-domain frames.