Download
1 / 17
190 likes | 263 Views
Watershed Health Indicators. By: Azarius Karanja WSCSD Kenya Adopt- A- River Project T.o .t Training, 7 th July 2015, Nairobi. A wetlands in Kenya. Measures of Stream Health. Physical Parameters. Water c olour , odour Water flow rate Water temperature Water turbidity

E N D
Watershed Health Indicators By: Azarius Karanja WSCSD Kenya Adopt- A- River Project T.o.t Training, 7th July 2015, Nairobi.
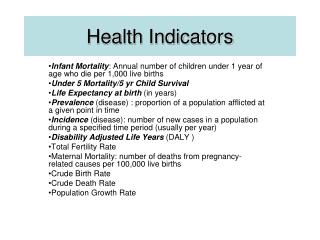
Physical Parameters • Water colour, odour • Water flow rate • Water temperature • Water turbidity • Nature of bottom substrate • Nature of the stream channel –bank erosion and stability
Chemical Parameters • pH • Dissolved Oxygen • Conductivity • Total Dissolved Solids • Total phosphorus • Reactive phosphate • Total nitrate
Biological Parameters • Type and structure of bank and aquatic vegetation • Algae growth and concentration • Chlorophyll a and diatoms • Faecalcoliform • Aquatic insects and other invertebrates • Functional structure of communities of fish, amphibians, reptiles, birds and mammals
Bio - Monitoring • Biological monitoring of wetlands health is based on the principle that incidence and intensity of environmental stressors is a function of the degree to which the chosen endpoint organism association deviates from its expected natural diversity.
Rationale for Bio-Monitoring • Biotic communities are affected by a multitude of chemical and physical influences the condition of the aquatic biota thus reflects the overall condition of a river ecosystem
Systems of Bio monitoring • River Invertebrate Prediction and Classification System (RIVPACS). • The RIVPACS and its derivative AusRivAS (Australian River Assessment Systems) are statistical models that predict the expected presence of aquatic macro invertebrate fauna at sites that have no environmental stressors.
These models have the advantage of having a high turnaround of results hence there use in rapid bio-assessment programs and they are easy to understand and apply by natural resources managers
The South African Scoring Index (SASS) Version 5 – SASS.5 • The (SASS) is a rapid bioassessment method for rivers developed over several iterations of refinement (Chutter 1994, 1998).This technique is the standard for the rapid bioassessment of rivers in South Africa and now forms the backbone of its National River Health Programme (Uys et al., 1996).
The method is designed for low/moderate flow and works best when the diversity of biotopes is and includes riffles or rapids. It has been asserted by Denis and Graham, (2002) that SASS.5 produces valuable results from poor habitats.
A comparison of the samples predicted to occur at test sites and those actually collected provides a measure of biological impairment at the test sites.
Why Macro Invertebrates? • Being ubiquitous, they are affected by perturbations in all types of waters and habitats • Large numbers of species offer a spectrum of responses to perturbations • The sedentary nature of many species allows spatial analysis of disturbance effects
Their long life cycles allow effects of regular or intermittent perturbations, variable concentrations, etc., to be examined temporally • Responses of many common species to different types of pollution have been established • Macroinvertebrates are well suited to experimental studies of perturbation
Qualitative sampling and analysis are well developed, and can be done using simple, inexpensive equipment • Taxonomy of many groups is well known and identification keys are available • Many methods of data analysis have been developed for macroinvertebrate assemblages
Normally benthic (river-bed) dwelling invertebrates • Insects, worms, molluscs and crustaceans (on the riverbed or channel margins) • Play important role in river functioning (retaining and breaking down of organics) • Useful for river characterization and monitoring • Small and relatively immobile, makes for easy collection