Download

1 / 18
180 likes | 198 Views
Community Health Status Indicators. M. C. Rice PhD APN BC, M.N. Wicks PhD RN, and S.I. White-Means PhD. Background. Cardiovascular disease (CVD) is responsible for premature deaths and costly hospitalizations in Memphis, TN. CVD ( heart disease and stroke) leading causes of death

E N D
Community Health Status Indicators M. C. Rice PhD APN BC, M.N. Wicks PhD RN, and S.I. White-Means PhD
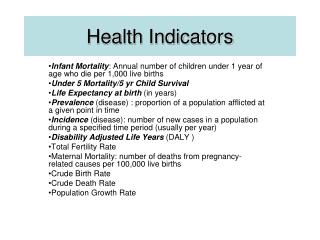
Background • Cardiovascular disease (CVD) is responsible for premature deaths and costly hospitalizations in Memphis, TN. • CVD ( heart disease and stroke) leading causes of death • Community Health Indicators –overview of health status
Background • Prevalence rate 27.3% for heart disease in Memphis • 31.8% of blacks and 23.5% of whites report a physician diagnosed them with heart disease • Prevalence rate for 37.3%hypertension • Overall, 40.9% HTN rate for blacks and 34.5% whites
Background National estimated prevalence of CVD is 6.6%, with little variability between blacks and whites
Purpose of Assessment Cardiovascular risks, depressive symptoms, and quality of life health indicators of 82 community residents and congregants in the 38126 zip were used to characterize health and health risk of the target population.
Demographic Characteristics of Residents an Congregants • Sixty one percent of CHEER participants were female and39 were males. • The majority of participants were between 45 and 56 years of age. • Twenty seven percent of CHEER participants graduated from high school and 27% had some college courses.
Methods and Procedures • Health behaviors were evaluated using a Health Risk Appraisal (HRA) survey. • Depressive symptoms were measured using the Center for Epidemiologic Studies Depression Scale (CESD).
Summary of Results • Health Factors Evaluated • Health Problems Identified
Weight Results • Thirty seven percent of the 81 participants had normal weight values • Twenty six percent of participants were in the over weight group and 37% were obese. T
Blood Pressure Results Average Systolic Blood Pressure- 136.43 Average Diastolic Blood Pressure- 84.7 The average values of the blood pressures of the 77 participants indicated that hypertension was not a problem. These values did, however, suggest that participants were in the pre-hypertensive category.
Cigarette Smoking Results • Thirty (36%) of the 64 participants are smokers. • Forty one (34%) of participants reported that they had never smoked
Blood Glucose and Cholesterol LevelsAverage glucose and cholesterol values indicated that diabetes nor high cholesterol levels were not problems problems in the majority of community or congregant participants
Nutritional Intake Results Sixty nine of the 80 CHEER participants ate foods that were high in fiber and 74 reported that their diets contained foods high in fat/cholesterol.
Physical Activity Results Forty one of the 80 participants reported that they exercised at least 3 days a week. The other 39 participants exercise 1-2 days a week.
Depressive Symptoms • Fifteen (10%) of the 68 participants had mild distress, 10 (15%) reported moderate distress, and 8 (12%) had severe distress. • Thirty (51%)participants indicated that they had no depressive symptoms.
Life Satisfaction Results • Fifty(63%) of 79 community residents and congregants were satisfied with their lives, • 19(24%) were partially satisfied, and 10 (13%) were not satisfied with their quality of lives.
Conclusions Major health risk indicators include: • Obesity • Diets high in fat • Lack of sufficient physical activity • Smoking
Implications Health indicators suggest that community participants need health promotion strategies to address nutrition, smoking cessation, overweight/obesity, and physical inactivity. Improving these risks could reduce cardiovascular risk in this population.