Download
1 / 19
190 likes | 312 Views
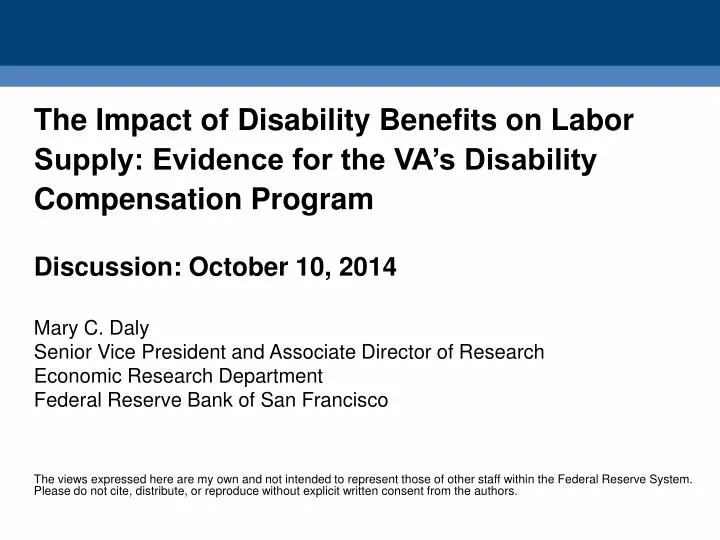
The Impact of Disability Benefits on Labor Supply: Evidence for the VA’s Disability Compensation Program Discussion: October 10, 2014 Mary C. Daly Senior Vice President and Associate Director of Research Economic Research Department Federal Reserve Bank of San Francisco

E N D
The Impact of Disability Benefits on Labor Supply: Evidence for the VA’s Disability Compensation Program Discussion: October 10, 2014 Mary C. Daly Senior Vice President and Associate Director of Research Economic Research Department Federal Reserve Bank of San Francisco The views expressed here are my own and not intended to represent those of other staff within the Federal Reserve System. Please do not cite, distribute, or reproduce without explicit written consent from the authors.
The Big Question Do Disability Benefits Affect Labor Supply?
Not Everyone Agreed... and so began 30 years of research
Why is it Hard to Get the Answer? Problem: It is difficult to identify an independent behavioral effect of the SSDI program • SSDI is an all or nothing system in terms of labor supply • SSDI benefits are only awarded to those deemed unable to work • Applicants cannot have worked for six months prior to application • Applicants cannot work while they are awaiting a decision • Beneficiaries can work a little, but very few do
The VA’s Disability Program is Different Veteran’s Disability Compensation Program • Does not restrict work except in minority of cases • Partial disability system, ranging from 0 to 100 percent CDR • Beneficiaries can increase CDR over time • Monthly benefits are dependent on CDR and not on past labor market earnings These features make it possible to link individual labor supply decisions to: (1) benefit receipt (2) benefit generosity But still need some form of exogeneity to identify a causal link.
The Clever Part of the Paper • Exploit 2001 policy change that made VA disability benefits more accessible and more generous for a subset of Veterans • Compare Vietnam-era vets affected by the change to Vietnam-era vets not affected by the change along four dimensions • VA disability compensation (DC) participation • Labor force participation • Earnings • SSDI/SSI participation • Use the relative outcomes for affected and unaffected vets as evidence of the causal impact of disability benefits on labor supply and SSDI/SSI participation
Why is This Even Nicer than it Seems The 2001 Policy Change Gave Presumptive Allowance to Vietnam Vets with Type II Diabetes to who were in theatre (BOG) This makes for a nice experiment for the following reasons: • Type II Diabetes is not usually completely debilitating so it does not imply an automatic withdrawal from the labor market • Vietnam was a sizeable war effort so the samples are reasonably large • Vietnam Vets are coming into the prime ages for disability receipt/labor supply choices
Figure 1. Scatter Plot: 95/20 Interpercentile Ratio vs. All-Cause Mortality Rate Gist of Their Experiment Notice the Trend Break in Veterans Disability Rolls Following 2001 Policy Change Expanding Benefits to Subset of Vets with Type II Diabetes In Theatre Vietnam Vets become eligible for disability based on Type II Diabetes
Figure 1. Scatter Plot: 95/20 Interpercentile Ratio vs. All-Cause Mortality Rate Substantial Evidence that Enrollment Increased Among the Treated Percentage Receiving VA Disability Percentage with Diabetes Award In Theatre=Eligible In Theatre=Eligible Not in Theatre=Ineligible Not In Theatre=Ineligible
Back to the Big QuestionDid Increased DC EnrollmentReduce Labor Supply?
Evidence Says Yes, But… What is driving it: access or generosity? • Recall, the 2001 policy change made VA disability benefits more accessible and more generous for in-theatre Vietnam Vets • Access increased because Type II Diabetes, a common illness, became a basis for a DC award • Generosity increased because new and existing awardees could combine this illness with other illnesses to get a higher cumulative disability rating (CDR) and a higher benefit • These two aspects of the change are potentially distinguishable (I am not sure) and likely important (I am more sure)
Figure 1. Scatter Plot: 95/20 Interpercentile Ratio vs. All-Cause Mortality Rate Enrollment Graph Suggests Mix of Effects Percentage with Diabetes Award In Theatre=Eligible Not In Theatre=Not Eligible The somewhat steeper increase in the percentage of vets with diabetes awards right after the change suggests the treated group is a mix of existing beneficiaries adding to their CDR and new beneficiaries qualifying based on diabetes.
Figure 1. Scatter Plot: 95/20 Interpercentile Ratio vs. All-Cause Mortality Rate Recall that Benefits Rise with the CDR
Figure 1. Scatter Plot: 95/20 Interpercentile Ratio vs. All-Cause Mortality Rate And CDRs Rise with Time on the Program Existing Beneficiaries New Beneficiaries
My Concern • The labor supply analysis combines existing beneficiaries with new entrants making it hard to know who is driving the result. • Is it that new BOG entrants look different than new NOG entrants • Or that existing BOG beneficiaries look different than existing NOG beneficiaries • It seems plausible that individuals get on the program, continue to work while they also invest in increasing their CDR. At some point they hit a threshold and exit the labor market. • Other scenarios are also plausible but figuring out which one best characterizes the behavior of this group would be useful. • Understanding this component of the labor supply results would make it easier to generalize these results to other settings
A Few Editorial Suggestions • Provide a data schematic to summarize the sample and highlight the data used for each portion of the analysis • Eliminate some of the jargon, e.g., loss year, BOG, NOG, etc. • Expand the motivation of the paper to fit into this larger literature about the effect of disability benefit on labor supply • Emphasize the outcomes for low-wage workers who have higher replacement rates and lower job opportunities
Ending Thoughts • One of the proposals being discussed for reforming the SSDI system is to move to a partial system like the VA • This analysis suggests that the labor supply effects of such a change could be considerable. • Another look at Parson’s concluding paragraph in 1980 JPE: