Download
1 / 15
180 likes | 431 Views
Labor Supply. Labor Supply. What is a labor supply curve? What is its shape? Why?. Labor Supply. Labor/Leisure model of Choice - Puts labor supply choice in framework of consumer theory. Preferences: Each individual cares about dollars of consumption goods (C) and leisure time (ℓ).

E N D
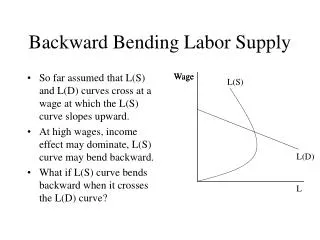
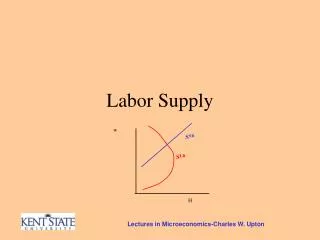
Labor Supply • What is a labor supply curve? What is its shape? Why?
Labor Supply Labor/Leisure model of Choice - • Puts labor supply choice in framework of consumer theory. Preferences: • Each individual cares about dollars of consumption goods (C) and leisure time (ℓ). • Assume that all else equal, people like more of each of them. • We can characterize an individual’s preferences over different bundles via indifference curves.
Labor Supply • Properties of Indifference Curves • Downward or Upward Sloping? Can they be U-shaped? • Is a bundle on higher indifference curve preferred to a bundle on lower indifference curve or vice versa? • Can indifference curves intersect? • Slope of Indifference Curve • What does it tell us? • What does it imply when Indifference curves are strictly convex to the origin?
Labor Supply $C ℓ
Labor Supply Budget Constraint (choice set) • Suppose an individual has 100 awake hrs/wk. • He can “sell” some of this time in the labor market (i.e. work) for $10/hr. (L) • Whatever time not spent working is the amount of leisure he gets to consume. • So C = 10*L and ℓ = 100 – L How can we graphically characterize all the possible bundles of consumption and leisure a person can consume at this wage with no non-labor income?
Labor Supply • What would happen to Budget Constraint if available wage increased (e.g. $15/hr)? How about if it decreased (e.g. $5/hr)? • What would happen to Budget Constraint if the individual had access to some non-labor income (e.g. $200/month)?
Labor Supply Hours of Work Decision • Our key assumption is that individuals are rational, which means they will choose their most preferred consumption/leisure bundle that is within their budget set. • So graphically, what will be an individual’s optimal bundle? • What will this mean about hours worked (i.e. labor supply at a given wage)?
Labor Supply We generally assume both consumption goods and leisure are “normal” goods. • What does this mean? • How would we show this graphically?
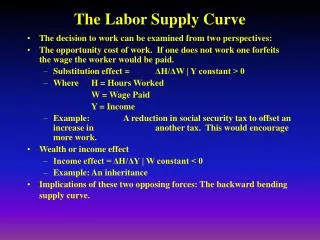
Labor Supply What happens to labor supply with an increase in wage? • It is a change in income, which will tend to reduce labor supply (income effect) • It is an increase in the relative price of an hour of leisure, which will tend to reduce leisure consumption and increase labor supply (substitution effect) • So how labor supply reacts to wage increase depends on which effect is larger.
Labor Supply What do we mean by a worker’s reservation wage? • How would we depict it graphically? • What will affect this reservation wage?
Labor Supply • How do we construct an individual’s labor supply curve from the labor/leisure model?
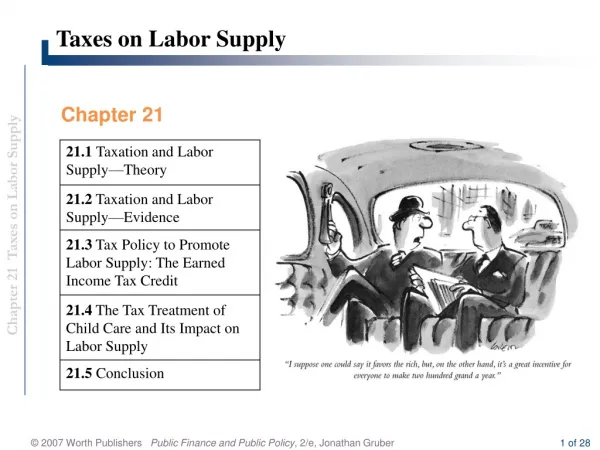
Labor Supply • What will happen to labor supply curve if we impose a proportional income tax (e.g. 25%)? • What will happen to labor supply curve if someone is given a lump-sum cash subsidy? • What will happen to labor supply curve if someone is given a proportional wage subsidy?
Labor Supply • So this gives an individual’s labor supply curve. How will we construct market supply curve for a given sector? • What will happen to market supply curve in a given sector over the longer-run? Why? • Why will different sectors have different short-run and longer-run labor supply curves?
Labor Supply • Supply Elasticity – The percentage change in labor supplies due to a 1% change in the market wage. • How does this relate to supply curve? • Why might different labor sectors have different supply elasticity? • Supply for Economics Professors • Supply for Ditch-diggers