Download
1 / 42
510 likes | 823 Views
Artificial Neural Network Application in Remote Sensing. Tim Ren M.S. Candidate Dept. of Natural Resource Science in URI (401) 874-9035 tren8835@postoffice.uri.edu 03/09/2001. Outline. Overview of the Study Artificial Neural Network(ANN) Introduction

E N D
Artificial Neural Network Application in Remote Sensing Tim Ren M.S. Candidate Dept. of Natural Resource Science in URI (401) 874-9035 tren8835@postoffice.uri.edu 03/09/2001
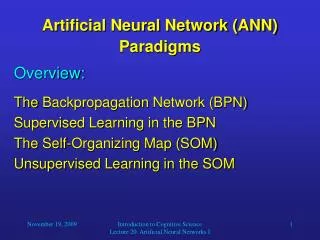
Outline Overview of the Study Artificial Neural Network(ANN) Introduction Rhode Island 1999 Land-use and Land-cover Classification Web-Based ANN System
Part I: Overview Part I: Overview
Remote Sensing Data Collection • Satellite Multispectral Data of EMR • Analog/Digital Transformation • Multi-band Digital Image (False color image)
Multi-source and Multi-spectral Spatial Data Band1 Band2 … … Band N GIS Aerial photo ... Multisource spatial data provide information from different perspectives in data modeling and information extraction.
Part II: Introduction to Artificial Neural Networks (ANN) • Neuron or PE (perceptrons) • Neural network structures • Working mechanism of Back-propagation ANN (BPANN) • Practical optimization algorithms on BPANN
ANN Architecture --- Processing Elements … … … … … … … … … PE Output PE Input unitj wj1 o1 wj2 o2 oj Σ, f o3 wj3
Back-propagation Mechanism • Compute total error • Compute the partial derivatives • Update the weights and go to next epoch W (t+1) = W(t) + E: =
Back-propagation Mechanism Error Global minimum Wij
Algorithms and Optimization Methods--- Update the Weights by What Rule? • Normal Back-propagation • Conjugate Gradient Method • Delta-Bar-Delta Rule • SuperSAB • Quickprop • Rprop (Resilient Back-propagation)
Coding --- Effective Way to Represent Data forest Integer format Binary format 0 0 1 0 1 0 0 0 0 0 1 0 1 1 0 1 0 0 1 1 1 1 0 1 1 1 0 0 0 0 0 1 0 1 0 1 0 0 0 0 0 1 1 1 0 0 0 0 0 0 0 1 1 0 0 1 40 45 61 193 80 112 25 • Increase number of weights • Enlarge the computation space • Increasing calculate time
Coding --- Network Structure for Coded Dataset Original Structure 6 input neuron After coded 48 input neuron
Part III Real World Application --- RI 1999 ANN Applied Classification • The original data • Process of ANN classification • Classification accuracy
Study Area --- Subset of RI 1999 ETM+ image Band 4,3,2 In RGB Band 5,4,3 In RGB Rhode Island 1999 ETM+
Choose signature for each class Supervised classification using ERDAS Final land-use and land-cover map Flow of Two Different Classification Methods Normal classification by ERDAS ANN classification Export to ASC Neural Network training NN engine process image (in ASC format) Land-use & Land-cover map (in ASC format) Import to Pixel
Turf / Grass Barren land Conifer forest Deciduous forest Mixed forest Brush Land Urban area Water Wetland 1 Wetland 2 How The Data Looks Like ? Different classes plotting using band 3 x 4 Different classes plotting using band 4 x 5
Turf / AGRI Barren land Conifer forest Deciduous forest Mixed forest Brush Land Urban area Water Wetland 1 Wetland 2 How The Data Looks Like ? Signature files of different classes plotting using band 3 x 4 x 5
Turf / Grass Barren land Conifer forest Deciduous forest Mixed forest Brush Land Urban area Water Wetland 1 Wetland 2 Classification Result Rhode Island 1999 Land-cover and Land-use map Rhode Island 1999 ETM+
Classification Result Zoom In --- Kingston Campus Turf / Grass Barren land Conifer forest Deciduous forest Mixed forest Brush Land Urban area Water Wetland 1 Wetland 2 Rhode Island 1999 ETM+ Rhode Island 1999 Land-cover and Land-use map
Part IV Web-Based Internet Implementation • Why we use Internet • How it works
1st layer --- Web Interface Tcl/tk and Tclet Training set files Neural Network Parameters Algorithm and Message Window
Communicate Layer --- Communication Protocol and Agent Send: Client side program (embedded in Interface) e.g. send EOS 12000 “ …..” Computation and classification result returned to the message window Tclet gathering variables and files Send transfer them to Server EOS Web Server Server: (stand alone program) Listen to port 12000 Neural Computation Engine
End --- Neural Computation Engine EOS Host Responses back to user interface Server: Listen to port 12000 Neural Computation Engine New process forked Parameters and training set transferred e.g. “neural < configuration files …. ”
What To Do Next ? • The internal mechanism of the weighs update. The trace of weight update Relation between error surface and the training data set • More algorithms and components to the neural engine • Methodology improvements (modularize ANN? ) • Effectively handle multi-user conditions on distributed architecture of the Web-ANN
Summary • We applied BP ANN in the classification of Rhode Island 1999 ETM+ data, we got reliable result. • Feed-Forward ANN is a powerful algorithm used in the remote sensing image process, however, a lot optimization must applied. • To expand the use of ANN, we developed a Web-based ANN interface and system, which is useful for not only the remote sensing classification but also in other data mining and data analysis.
Acknowledgement • Lab for Terrestrial Remote Sensing • Environmental Data Center • Dr. Y. Q. Wang • Dr. Y. Wang • NASA Grant No. NAG58829
Index of Appendixes • I: BP ANN --- Error space, weight adaptive technologies • II: Coding examples • III: Different signature for different classes plotting • IV: What input format to choose --- gray code VS. integer value • V: Benchmark --- how many neurons in hidden layer gives the best result • VI: Communicate agent --- “send” and “server” • VII: Multi-user solution
Appendix I BP ANN---Error Space, Weight Adaptive Technologies Steps Total Error Wkl Wij
Appendix II Coding Examples In integer format forest ( 40 45 61 193 80 112 25 ) Integer Binary format Gray code format 7 0 0 0 0 0 1 1 1 0 0 0 0 0 1 0 0 8 0 0 0 0 1 0 0 0 0 0 0 0 1 1 0 0 9 0 0 0 0 1 0 0 1 0 0 0 0 1 1 0 1
Coding Examples --- Classification Process Landsat TM Band1 Band2 Band3 Band4 Band5 Band6 Band7 Observation space Solution space Mapping Relationship 0~255 0~255 0~255 0~255 0~255 0~255 0~255 Category 1 Category .. Category … Category … Category … Category … Category N Water wetland Forest Agri. Urban Residential Methods: Linear Non-linear Statistical ANN
Coding Examples • Integer pattern 40 45 61 193 80 112 25 (Pattern Mapping) Forest • Coded pattern 0 0 1 0 1 0 0 0 0 0 1 0 1 1 0 1 0 0 1 1 1 1 0 1 1 1 0 0 0 0 0 1 0 1 0 1 0 0 0 0 0 1 1 1 0 0 0 0 0 0 0 1 1 0 0 1 (Pattern Mapping) Forest
Conifer forest Deciduous forest Mixed forest Wetland 1 Wetland 2 Brush Land Appendix III Different Signature for Different Classes Plotting All 6 Vegetation Band 3 x 4 Band 4 x 5
Appendix III Different Signature for Different Classes Plotting Urban and Barren land Band 3 x 4 Band 4 x 5 Barren Land Urban area
Appendix IV What Input Format to Choose --- Gray-code VS. Integer Value Benchmark on different input format Integer Format - 6 input neurons Gray Code Format - 48 input neurons
Appendix IV What Input Format to Choose --- Gray-code VS. Integer Value
Appendix V Benchmark --- How Many Neurons in Hidden Layer Gives the Best Result 48-150-9 ( 48 inputs, 150 hidden neurons, 9 output classes) 48-250-9 ( 48 inputs, 250 hidden neurons, 9 output classes) 48-350-9 ( 48 inputs, 350 hidden neurons, 9 output classes)
Appendix V Benchmark --- How Many Neurons in Hidden Layer Gives the Best Result
Appendix VI Communicate Agent --- “send” and “server” Commands: 1.compute: add, sub 2.system commands: start "Unix commands" 3.stop command: stop pid 4.system load: uptime,loadaver 5.collect data: fetch filename 6.send file: post filename Example: send eos 12000 "add 1 2" send eos 12000 ”start neural < configure_file " Socket “4” send eos 12000 “add 1 3”
Appendix VII Multi-user Solution Socket Socket 1. Assign a new Work ID. 2. Create a unique working directory to avoid file conflict. 3. Clear temporary working directory