Download

1 / 41
410 likes | 584 Views
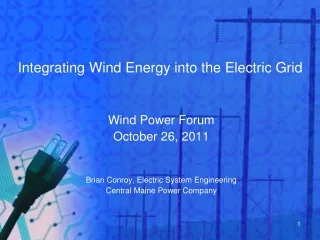
Integrating Wind Power into the Electric Power System. Ed DeMeo Renewable Energy Consulting Services, Inc. Technical Advisor, Utility Wind Integration Group. Michael Milligan National Renewable Energy Laboratory Consultant, National Wind Technology Center.

E N D
Integrating Wind Power into the Electric Power System Ed DeMeo Renewable Energy Consulting Services, Inc. Technical Advisor, Utility Wind Integration Group Michael Milligan National Renewable Energy Laboratory Consultant, National Wind Technology Center Michigan Public Service Commission Wind Forum April 25, 2007 Lansing, Michigan
Overview • Integration Issues and Wind Economics • Electric Utility Planning and Operations: Wind Impacts Overview • Wind Integration Perspective from Around the Nation • Environmental Issues: Impact on Wind Economics and Integration DeMeo Milligan Milligan DeMeo DeMeo
Key Integration Issues • Costs (capital, energy, O&M) • Variability Impacts (ancillary services costs) • Energy (fuel displacement) and Capacity (serving demand growth) Contributions • Environmental Considerations
Wind Energy Cost Trend 1979: 40 cents/kWh 2000: 4 - 6 cents/kWh (no subsidy) • Increased Turbine Size • R&D Advances • Manufacturing Improvements • Operating Experience NSP 107 MW Lake Benton wind farm 4 cents/kWh (unsubsidized) 2004: 3 - 5 cents/kWh (no subsidy) Today: Somewhat higher increased commodity costs; unstable market conditions
Natural Gas Situation “Today’s tight natural gas markets have been a long time in coming, and distant futures prices suggest that we are not apt to return to earlier periods of relative abundance and low prices anytime soon.” • Alan Greenspan, Federal Reserve Chairman, Testimony at Senate hearing, July 10, 2003 Wellhead gas costs - 2002-2003: $3 - $5/MMBTU Current prices and projections exceed $6/MMBTU
Cost Comparison • Wind total capital cost: about $1,600 kW today • Wind energy cost: about 5.5¢/kWh (6.5¢ without PTC) • Includes 0.5 to 1.0¢/kWh for O&M • Wind energy costs are stableover plant lifetime Natural-gas plant fuel cost (HR 7,000 - 10,000) $/MMBTU: 24 68 10 gas cost ¢/kWh:1.4 - 2 2.8 - 4 4.2 - 65.6 - 87.0 - 10fuel only • Wind-gas synergy: save gas when wind blows; burn gas to maintain system reliability during low winds
Wind Variability Impacts • To what extent is wind energy value reduced by increased operating costs for the rest of the power system? • How is the power system’s ability to reliably meet load demands affected by wind-plant output uncertainties?
Time Frames of Wind Impact Match System Operation Tasks/cycles • Power systems can already handle tremendous variability • Capacity value (planning): based on reliability metric (ELCC=effective load carrying capability) • Scheduling and commitment of generating units -- hours to several days -- wind forecasting capability? • Load-following -- tens of minutes to a few hours -- demand follows predictable patterns, wind less so • Regulation -- seconds to a few minutes -- similar to variations in customer demand
Meso-scale meteorological modeling that can “re-create” the weather at any space and time Model is run for the period of study and must match load time period Wind plant output simulation and fit to actual production of existing plants Where Does Wind Data Come From? Minnesota: Xcel Colorado: Xcel
How is Regulation Impact Calculated? • Based on actual high-frequency (fast) system load data and wind data • If wind data not available, use NREL high-resolution wind production data characteristics • Impact of the wind variability is then compared to the load variability • Regulation cost impact of wind is based on physical impact and appropriate cost of regulation (market or internally provided) • Realistic calculation of wind plant output (linear scaling from single anemometer is incorrect)
How is Load Following Impact Calculated? • Based on actual system load data • …and wind data from same time period • Meteorological simulation to capture realistic wind profile, typically 10-minute periods and multiple simulated/actual measurement towers • Realistic calculation of wind plant output (linear scaling from single anemometer is incorrect) • Wind variability added to existing system variability Implies no one-one backup for wind
How is Unit Commitment Impact Calculated? • Requires a realistic system simulation for at least one year (more is better) • Compare system costs with and without wind • Use load and wind forecasts in the simulation • Separate the impacts of variability from the impacts of uncertainty
Uses similar data set as unit commitment modeling Generation capacities, forced outage data Hourly time-synchronized wind profile(s) Several years’ of data preferred Reliability model used to assess ELCC Wind capacity value is the increased load that wind can support at the same annual reliability as the no-wind case How is Capacity Value Calculated?
High-Penetration Cases • Minnesota PUC: 15-25% wind penetration (based on energy) (TRC) • California Intermittency Analysis Project (Follow-on to earlier RPS Integration Study; team participation) • Pacific Northwest: NW Wind Integration Action Plan (and Forum) • Idaho Power: about 30% (peak) (no TRC) • Avista: 30% peak (no TRC); some informal review at Utility Wind Integration Group (UWIG) • BPA: analytical work in progress; integration cost is consistent with others • Potential follow-on work to the NW Wind Integration Action Plan (NWIAP) on regional basis • Northwest Wind Integration Action Plan: http://www.nwcouncil.org/energy/Wind/Default.asp
Renewable Energy Studies in CA • RPS Integration Cost Analysis: NREL, ORNL, Dynamic Design Engineering, California Wind Energy Collaborative for the CA Energy Commission • Used actual renewable generation, load, and conventional data from ISO Power Information database • GE/Exeter/Davis Intermittency Analysis Project for the Energy Commission • Analysis of future scenarios of renewable energy • Both analyses looked at wind, solar, geothermal, and biomass
CA RPS Integration Cost Project • Examining impacts of existing installed renewables (wind 4% on a capacity basis) • Calculated regulation, load following impacts of all renewables • Capacity value (effective load carrying capability, ELCC) for all renewables • Regulation cost for wind $0.46/MWh • Load following: minimal impact • Wind capacity credit 23%-25% of benchmark gas unit http://www.energy.ca.gov/reports/reports_500.html
California Intermittent Analysis Project • Up to 24% wind (rated capacity to peak) • Savings • WECC nearly $2B • CA $760M • Wind forecast benefit $4.37/MWh • Regulation cost up to $0.67/MWh • Unit commitment w/forecast results in sufficient load following capability (and no load following cost) • http://www.energy.ca.gov/pier/notices/
Load Following Impacts in CA • RPS Integration Cost Analysis found little discernable impact • Deep dispatch stack provided by market • IAP found similar result • Deep CA dispatch stack, augmented by the Western electricity market
Factors that Influence Integration Costs: Results and Insights • Wind penetration • Balancing area (control area) size • Conventional generation mix (implication for higher penetration and new balance-of-system capabilities • Load aggregation benefits • Wind resource geographic diversity • Market-based or self-provided ancillary services • Size/depth of interconnected electricity markets • Unit commitment and scheduling costs tend to dominate • Realistic studies are data intensive and require sophisticated modeling of wind resource and power system operations
Emerging Study/Methods Best-Practices • Start by quantifying physical impacts • Divide the impacts by time scale corresponding to grid operation cycles • Analyze cost impact of wind in context of entire system in each time scale based on physical requirements • Load variability • Wind variability • System operator must balance TOTAL of all loads and resources, not individuals • Capture wind deployment scenario geographic diversity through synchronized weather simulation • Re-create “real” wind forecasts
Stakeholder ReviewEmerging Best Practices • Technical review committee (TRC) • Bring in at beginning of study • Discuss assumptions, processes, methods, data • Periodic TRC meetings with advance material for review • Examples in Minnesota, Colorado, California, New Mexico, and interest by other states
Minnesota 25% Wind Energy Penetration Study (MN DOC 2006) • For 3500 to 5700 MW of wind generation delivered to MN load (15 to 25% of retail electric energy sales in 2020) • An increase of 12 to 20 MW of regulating capacity • No increase in contingency reserves • An increase of 5 to 12 MW in 5 minute variability • Incremental operating reserve costs of $0.11 per MWh of wind generation in the 20% case
Minnesota 25% Wind Energy Penetration Study (MN DOC 2006) • Bottom Line: The addition of wind generation to supply 15, 20 and 25% of Minnesota retail electric energy sales can be reliably accommodated by the electric power system • The total integration operating cost for up to 25% wind energy is less than $4.50/MWh of wind generation. Key drivers are: • A geographically diverse wind scenario • The large energy market of the Midwest Independent System Operator (MISO) • Functional consolidation of balancing authorities • Sufficient transmission (i.e. minimal congestion)
System Operating Costs Impacts: Results from Recent Studies ($/MWh) Penetra- tion (%) 3.5 20 7 29 15 15 20 34 Regula- tion 0 0 0.19 1.02 0.20 0.23 0.11 0.23 Load- Follow 0.41 1.6 0.28 0.15 0 0 0 0 Unit- Commit 1.44 3.0 1.40 1.75 4.77 4.37 2.00 4.18 Total Impact 1.85 4.6 1.87 2.92 4.97 4.60 2.11 4.41 Study UWIG/Xcel Pacificorp BPA/Hirst We Energies Xcel/PSCO Xcel/MNDOC MN/MNDOC MN/MNDOC
Range of System Operating Cost Impacts Studies Conducted To Date 6 4 2 0 1/2 ¢/kWh Integration Cost ($/MWh) 0 5 10 15 20 25 30 Wind Penetration (% of System Peak Load) All results to date fall within the crosshatched area
GE Energy/NYISO/NYSERDA New York Wind Evaluation • Comprehensive study of wind’s impacts on transmission system planning, reliability and operations • 3,300 MW of wind in system serving 34,000 MW of customer load (10% wind penetration) • Energy prices based on functioning commercial wholesale markets -- day-ahead and hour-ahead • All previous studies based on operating costs only • Assumes wind is a price-taker • Market (demand-supply balance) sets price; wind generators are paid the market price
GE Energy/NYISO/NYSERDA New York Wind Evaluation • Overall Conclusion: NY State power system can reliably accommodate at least 10% wind (3,300 MW) • Minor adjustments to planning, operation and reliability practices • Total NY system (less wind) variable operating costs (fuel, plant startup costs, etc.) reduced by $350 M • State-of-the-art wind forecasting contributed $125 M of this reduction (about 80% of perfect-forecast value) • Electricity costs reduced statewide (0.18¢/kWh -- all kWh) • System transient stability improved
Wind’s Contributions to Electric Power Energy: displacement of fossil fuels • In most cases, this is the primary motivation. Previously existing power plants run less, but continue to be available to ensure system reliability. • Contrary to common lore, addition of a wind plant requires NO new conventional backup generation to maintain system reliability. • In many cases, natural gas is saved, reducing total system operating costs. In all cases, overall emissions are reduced.
Wind’s Contributions to Electric Power Capacity: meeting new load growth • Wind generally less effective in this respect than conventional generation. Winds may be low during peak electricity demand periods. • But addition of a wind plant will allow some new load to be served. The amount depends on many factors. Examples: New York about 10% Long Island about 40% Minnesota about 10% • With experience and over time, operating strategies and generation mix will evolve so that combinations like wind, hydro and natural gas will serve new load reliably.
IEEE Power Engineering Society Magazine, November/December 2005 • Utility Wind Integration Group (UWIG): Operating Impacts and Integration Studies User Group • www.uwig.org
UWIG Summary: Key Points from IEEE Power Engineering Society Magazine, Nov/Dec 2005 • www.uwig.org
Environmental Tradeoffs We need to evaluate environmental impacts on a relative basis. No energy-generation approach is without impacts. The choice is wind vs. something -- not wind vs. nothing.
“We can’t lose sight of the larger benefits of wind,” says Audubon Washington’s Tim Cullinan. “The direct environmental impacts of wind get a lot of attention, because there are dead bodies on the ground. But nobody ever finds the bodies of the birds killed by global warming, or by oil drilling on the North Slope of Alaska. They’re out there, but we don’t see them.” Audubon Magazine, September 2006 feature article on wind power
Environmental Benefits of Wind • No emissions of any kind during operation • No SOx, NOx, particulates or mercury • No contributions to regional haze • No greenhouse gases • No toxic wastes or health impacts • Nuclear waste transport and storage unresolved • Respiratory diseases of growing concern • No water consumption or use during operation • Water availability a looming crisis in the Western US
Environmental Benefits of Wind • Global climate change concerns can no longer be ignored by any legitimate political entity • Most environmental scientists view this as by far the most serious environmental issue facing society • Unavoidable evidence mounting • Very few doubters remain • Not many arrows in the quiver to address this concern • We need them all • Wind energy is one of them
Paul Anderson, CEO of Duke Energy(Southeastern Utility, Coal/Nuclear) Lobbying for tax on carbon dioxide emissions “Personally, I feel the time has come to act - to take steps as a nation to reduce the carbon intensity of our economy. And it’s going to take all of us to do it.” • Paul Anderson, quoted in AP press release, published April 7, 2005
Wind Contributions in Europe and the United States (2006) Generation Total (MW)* Wind (MW) Wind % of Electricity • Germany • Spain • Ireland • Denmark • USA 85,000 50,000 5,500 4,200 900,000 22,000 11,600 600 3,100 11,300 7 8 6 30 0.6 * Approximate values
Contrasting Approaches to Accommodating Wind Power in Europe and in the U.S. EuropeWind power is environmentally preferred. How can we best accommodate it within the existing power system? U.S. OK, we’ll accept wind into the existing system, but it will follow our traditional rules and procedures. A change in mindset is needed in the U.S. It will not come from within the power sector, whose responsibility is reliability, not change. Change, and the incentives to enable it, must originate in the policy sector.
The Climate Change Threat Is A Major Business Opportunity • Technologies to reduce CO2 emissions are needed worldwide • Industries producing them will provide employment and profits • Countries that produce them will enjoy export potential and trade-balance benefits • Countries that do not may miss out on one of the 21st Century’s best business opportunities
Bottom Line on Wind Power Wind power is a very low carbon, affordable, domestic energy source It can make a large contribution to the US economy -- 20% of electricity and more As a responsible society, we need to use it -- and use our ingenuity to resolve the tactical issues it presents