Download
1 / 22
220 likes | 318 Views
AMS 25 th Conference on Hydrology Seattle, WA January 25, 2011. Gregory S. Karlovits, now with USACE Jennifer C. Adam (presenting), Washington State University. Probabilistic Climate Change Analysis for Stormwater Runoff In the Pacific Northwest. Introduction.

E N D
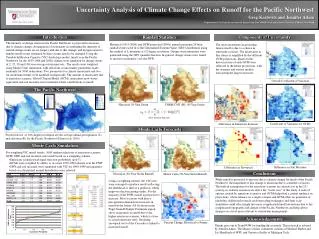
AMS 25th Conference on Hydrology Seattle, WA January 25, 2011 Gregory S. Karlovits, now with USACE Jennifer C. Adam (presenting), Washington State University Probabilistic Climate Change Analysis for Stormwater Runoff In the Pacific Northwest
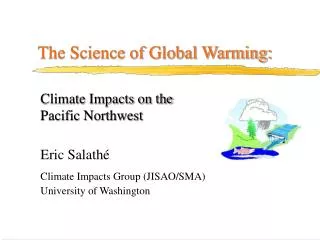
Climate Change in the PNW 2045 Temperature Relative to 1970-1999 • Larger agreement among GCMs for annual temperature than for annual precipitation • However, seasonality and extreme events also important Precipitation Relative to 1970-1999 From Mote and Salathé (2010), University of Washington Climate Impacts Group
Sources of Uncertainty in Predicting Stormwater Runoff under Climate Change • Future Meteorological Conditions • Future Greenhouse Gas (GHG) emissions • Global Climate Model (GCM) structure and parameterization • Downscaling to relevant scale for hydrologic modeling • Hydrologic Modeling • Hydrologic model structure, parameterization, and scale • Antecedent (Initial) Conditions • Soil moisture • Snowpack / Snow Water Equivalent (SWE)
Objectives • At the regional scale, how will stormwater runoff from key design storms change due to climate change? • What is the range of uncertainty in this prediction and what are the major sources of this uncertainty? • How can we make these forecasts useful to planners and engineers?
General Methodology • For key design storms, find changes in storm intensities for different emission scenarios/GCMs • Use a hydrology model to compare future projected storm runoff to historical • Use a probabilistic method to assess range and sources of uncertainty
Design Storms • 24-hour design storms with average return intervals of 2, 25, 50 and 100 years • Statistical modeling using Generalized Extreme Value (GEV) using method of L-Moments (Rosenberg et al., 2010) • Meteorological data: from Elsner et al. (2010): gridded at 1/16th degree over PNW • Historical: 92 years of data (1915-2006) • Future: 92 realizations of 2045 climate, hybrid delta statistical downscaling
VIC Macroscale Hydrology Model • Variable Infiltration Capacity (VIC) Model • Process-based, distributed model run at 1/2-degree resolution • Sub-grid variability (vegetation, elevation, infiltration) handled with statistical distribution • Resolves energy and water budgets at every time step • Routing not performed for this study Gao et al. (2010), Andreadis et al. (2009), Cherkauer & Lettenmaier (1999), Liang et al. (1994)
Monte Carlo Framework • Random Sampling from: • Future Meteorological Conditions • Future Greenhouse Gas (GHG) emissions • Global Climate Model (GCM) structure and parameterization • Downscaling to relevant scale for hydrologic modeling • Hydrologic Modeling • Hydrologic model structure, parameterization, and scale • Antecedent (Initial) Conditions • Soil moisture • Snowpack • Modeled in VIC, fit to discrete normal distribution
Monte Carlo Framework, cont’d • For each return interval, 5000 combinations were selected for VIC simulation • GCM weighted by backcasting ability as quantified by Mote and Salathé (2010) • Approach based on Wilby and Harris, 2006, WRR
Monte Carlo Results (Average of 5000 Simulations) Historical Future Historical 50-year storm Random selection of soil moisture and SWE Future 50-year storm Random selection of emission scenario, GCM, soil moisture and SWE
Monte Carlo Results, Continued Percent change, historical to future runoff due to 50-year storm Coefficient of variation for runoff for 5000 simulations of 50-year storm
Isolation of Uncertainty due to GCM All Sources GCM only Coefficient of variation for runoff for 5000 simulations of 50-year storm Coefficient of variation due to selection of GCM only (50-year storm)
Uncertainty Estimation for Individual Grid Cells Canada Washington State Palouse Watershed Oregon
Conclusions • Runoff is projected to increase for many places in the Pacific Northwest • Largest increases related to most uncertainty • Range and sources of uncertainty highly variable across the PNW • Probabilistic methods can improve forecasts and isolate sources of uncertainties • enables us a better understanding on where to focus resources for improved prediction • Need for more comprehensive uncertainty assessment and higher resolution studies
Questions? Chehalis, WA Photo: Bruce Ely (AP) via http://www.darkroastedblend.com/2008/06/floods.html
Outline • Introduction: • Pacific Northwest (PNW) climate change • Sources of uncertainty in predicting hydrologic impacts • Data, model and methods • Climate data • Design storms • Hydrologic model • Monte Carlo simulation • Results and uncertainty analysis
Isolation of Uncertainty: Emission Scenario Absolute Difference (A1B – B1) As a Percentage of Historical Absolute difference in runoff due to emissions scenario (A1B – B1) (mm) Difference (A1B – B1) as a percentage of historical (%)