Download
1 / 14
140 likes | 249 Views
THE DECOMP PHYSICAL MODEL. DECOMP Adaptive Management Plan (DAMP ): Physical Model . Purpose To address uncertainty and constraints in Everglades restoration to assist in the DECOMP PIR. Use multi-agency collaborative approach (with stakeholder input).

E N D
DECOMP Adaptive Management Plan (DAMP): Physical Model • Purpose • To address uncertainty and constraints in Everglades restoration to assist in the DECOMP PIR. • Use multi-agency collaborative approach (with stakeholder input). • To refine our understanding of ecological benefits to support the selection of alternative plans. • Find best restoration design for DECOMP, without compromising water supply or flood control. • To obtain a better scientific understanding of how “pristine” and “impacted” regions of the ecosystem will respond to hydrologic restoration.
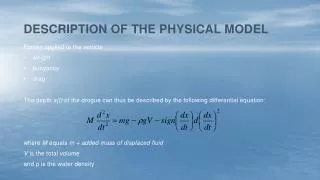
Physical Model Concept- Move water along historic flow paths from WCA-3A through temporary controllable openings in the L-67A levee, through the “pocket”, to canal and levee modifications on the L-67C. Physical Model Design Factors- Operate within the current and future operational constraints (e.g., water depths in WCA-3B and L-29). Adhere to water quality standards set forth in the Everglades Forever Act. Minimize the impact to recreation. Remain within the $10.3 million dollar cost cap. S151 Mean Phosphorus 15-20 ppb S333 Mean Phosphorus 11-12 ppb
X X X X X X X X X X X X X X X X X X X X X X X X X X X X • DECOMP UNCERTAINTIES I-75 PIR 3 –Backfill/Degrade L-68A 1) The extent to which canals need to be Backfilled 2) The need for sheet flow to maintain ridge and slough patterns 3) The hydrologic and ecological effects of levee modification 4) Hydrologic tolerances of tree islands 5) Stage and seepage relationships 6) Model calibration MIAMI CANAL L-67A PIR 3 – Weirs in L-67A L-67C WCA 3A X X X X PIR 2 – Backfill/Degrade Miami Canal X PIR 2 – Add S-345s Physical Model PIR 3 –Backfill/Degrade L-67C PIR 3 –Backfill /Degrade L-28/L-29 PIR 3 – Backfill L-67A WCA 3B X PIR 3 – Remove S-12s, 343s, 344 PIR 2 – Raise & Bridge East Portion of TT PIR 3 – Bridge West Portion of TT PIR 2 – Degrade L-29 Levee/Canal X X X X X X X X X X X X X X X X X X X X X X X X X 4
THE DAMP PHYSICAL MODEL L-67A Levee L-67C Levee • Prius v.3.4 • February 2008 • Coupled to Modified Water Delivery features • Budget projection • ~$4 million construction • ~$6 million science L-67 Pocket BACI Flow-way with one 9,000 ft L-67C gap Repeated Measure Flow-way 5
The Science Plan Schedule • National Environmental Policy Act (NEPA) • NEPA Scoping Meeting Feb 2009 • Draft EA Sep 2009 • Final EA; NEPA Complete Jan 2010 • Experimental Design • Finalize DPM Experimental Design Feb 2009 • Develop Science Plan Jun 2009 • Scientific Peer Review Sep 2009 • Design Plans and Specs • Plans and Specs Jan 2010-Apr 2011 • Installation and Testing • Pre Impact Monitoring Oct 2010-Sep 2012 • Construction Apr 2011-May 2012 • Post Impact Monitoring Oct 2012-Feb 2014 • Removal Mar 2014
November 2009 DECOMP PHYSICAL MODEL L-67A 750 cfs Culvert WCA-3A WCA-3B <2 cm/sec DPM Ecological Benefits of Sheet flow Tamiami Trail L-67C Degraded Levee (3000’) L-67C Canal Backfill (1000’ per treatment) Canal Backfilling Options >2 cm/sec
THE DPM Statistical Design and Schedule Before After Before After Control Impact (BACI) IMPACT Monthly Mean TP Concentration at S-151 Response variable Treatment Control Time Operational Window (OW)- period when operational constraints are minimized and hydrologic conditions are optimal. Estimated window is 17-41 days.
Figure 3-8: Example of a Rhodamine dye tracer release to study surface flow patterns through sloughs and ridges. DPM Utilizes State-of-the-Art Technologies in an Integrated Approach to measure a wide array of physical, biological, and chemical processes Particle Transport Flow Patterns Flow Patterns Erosion
SUMMARY • DPM is a BACI designed experiment to evaluate uncertainty associated with DECOMP: • Canal Backfilling • Ridge and Slough Development • Designed within the DECOMP footprint with due consideration to operational and environmental constraints. • An interdisciplinary approach brings together multiple agencies with vast scientific and engineering experience in the Everglades. • The agencies are also well equipped for conducting this work. • Mechanisms are in place to report findings to decision makers in a timely manner.
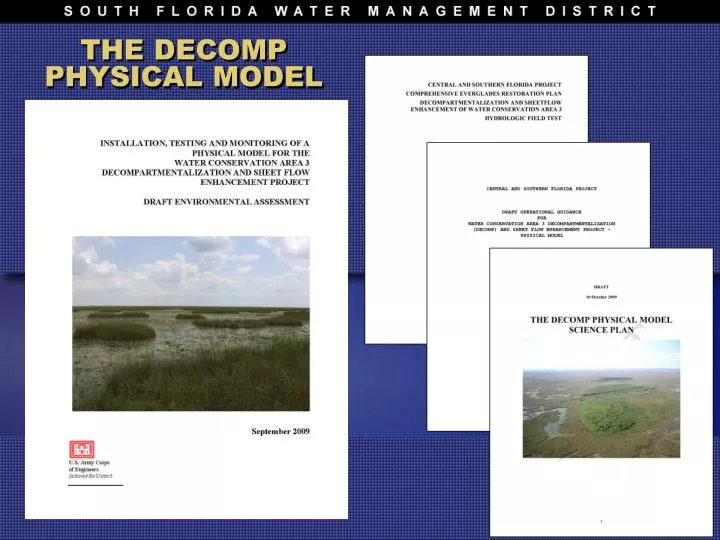
ENVIRONMENTAL ASSESSMENT Hydrologic Field Test Operational Guidance Science Plan
The Issue • By February 2005 it was recognized by the DECOMP Project Development Team (PDT) that there were fundamental problems hindering the development of the Project Implementation Report (PIR). • Decomp Scientific Uncertainties: • Effects of partial versus extensive backfilling of canals • Quantification of the ecological benefits of sheetflow • Ecological effects of levee modifications • Water depth and hydroperiod tolerance of tree islands • Assessment of seepage • Calibration of hydrologic models
MEASUREMENTS THE DPM SCIENCE PLAN • Hydrology • A monitoring network for stage, depths, flows, and velocities. • Hydraulics of L-67A culverts (head and tail water stages and cfs). • Synoptic mapping of water depth and velocity in conjunction with flow manipulations. • Vegetation mapping for hydraulic resistance. • Tracer studies to map direction and velocity of surface water flows. • Intensive monitoring (flow direction and velocity, water depths and stages). • Physical Transport • Synoptic mapping of sediment erosive properties.& surface water biogeochemistry. • Intensive monitoring (resuspension, deposition, floc tracers, sediment traps, biogeochemical markers, ecosystem metabolism) • Biological • Environmental monitoring (dissolved oxygen, pH, temperature, specific conductivity). • Fauna characterization and movement (Native and Exotic) • Vegetation monitoring.
Operational Window (OW) October-January Estimated 17-41 days of Operation Mean Monthly Predicted Velocity at S-71 Gauge Monthly Mean Stage Difference WCA-3the B-WCA-3A Monthly Mean TP Concentration at S-151 Mean Monthly Stage at S-71 Gauge