Download
1 / 16
160 likes | 271 Views
ADC Performance and Calibration of MDT Chambers. Zhen YAN ( 闫真 ) Boston University USTC 15.12.2012. Outline. Introduction of Monitored Drift Tube(MDT) System Naming convention O peration parameters TDC and ADC spectrum Boston University activity ADC performance

E N D
ADC Performance and Calibration of MDT Chambers Zhen YAN (闫真) Boston University USTC 15.12.2012
Outline • Introduction of Monitored Drift Tube(MDT) System • Naming convention • Operation parameters • TDC and ADC spectrum • Boston University activity • ADC performance • Monitoring chamber ADC mean • Color map of chamber ADC mean plotted as function of eta and phi • Chamber ADC mean variation at time scale • ADC calibration • Raw tube ADC performance • Normalized tube ADC performance • Correction constants validation • Dependence of ADC on impact parameter, distanceToReadout, temperature and momentum
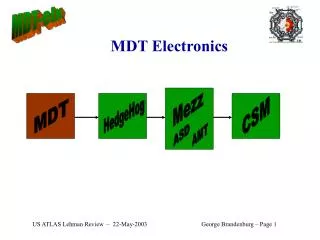
Boston University Activity The BU/Harvard group led by Ahlen built the 80 MDT chambers for the Small Wheels (16 each of EIL 1-3, and EIS 1-2), and the 16 EMS1 chambers for the Big Wheels, during the period 2000 to 2004. The MDT-ASD is an octal CMOS ASIC circuit which was designed and constructed by the BU Electronics Design Facility (EDF) and Harvard. In each ASD channel, an ADC was used to measure the signal charge in a given time window (integration gate 18.5ns) following the initial threshold crossing. The signal charge is encoded into a pulse width using the dual-slope ”Wilkinson” technique with time unit 0.78 ns, the same as the TDC unit.
Plot a) is the ADC spectrum of EIL1A01 for all tubes and events in one collision run 182796 in May 2011. Plot b) shows the distribution of chamber ADC mean values for 1170 MDT chambers for run 182796. The normal range of chamber ADC mean is 125 to 145 ADC count for a 7TeV collision run.
The red cell at the top-left of below plot indicates chamber EIL4C03 has an unusually high ADC mean value during cosmic commissioning in 2009. This was found to be due to a problem with the LV power supply cable.
The rms of chamber ADCmean values was calculated by using 20 collison runs listed in tag “2011 7TeV” taken from March 2011 to May 2011. The rms is less than 1 ADC count for most chambers, demonstrating very stable for the MDT system.
A constant named cor tube[N] can be used to normalize tube ADC value. The definition of cor tube[N] is cor tube[N] = ChamberADCMean/TubeADCMean[N], then the NormalizedADC = cor tube[N]*rawADC. We have used 2010 and 2011 collision data to compare normalization constants over a one year time scale, using over 270,000 tubes. Below plot shows these constants to be very stable.