Download
1 / 27
290 likes | 348 Views
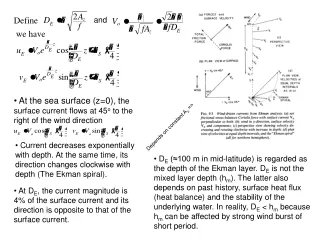
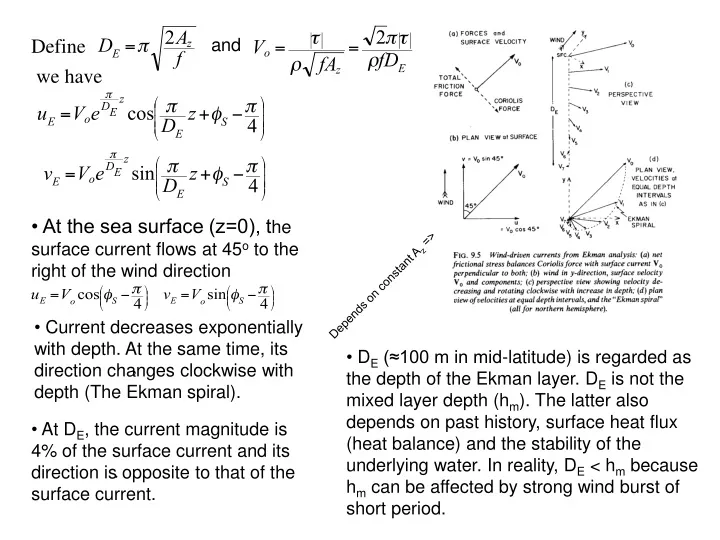
Define. and. we have. • At the sea surface (z=0), t he surface current flows at 45 o to the right of the wind direction. Depends on constant A z =>. • Current decreases exponentially with depth. At the same time, its direction changes clockwise with depth (The Ekman spiral).

E N D
Define and we have • At the sea surface (z=0), the surface current flows at 45o to the right of the wind direction Depends on constant Az => • Current decreases exponentially with depth. At the same time, its direction changes clockwise with depth (The Ekman spiral). • DE (≈100 m in mid-latitude) is regarded as the depth of the Ekman layer. DE is not the mixed layer depth (hm). The latter also depends on past history, surface heat flux (heat balance) and the stability of the underlying water. In reality, DE < hm because hm can be affected by strong wind burst of short period. , • At DE, the current magnitude is 4% of the surface current and its direction is opposite to that of the surface current. .
Other properties (1) Relationship between surface wind speed W and (Vo, DE). Wind stress magnitude ) ( , , (2) Relationship between W and DE. Ekman’s empirical formula between W and Vo. , outside ±10o latitude (3) There is large uncertainty in CD (1.3 to 1.5 x 10⁻³ ±20% for wind speed up to about 15 m/s). CD itself is actually a function of W. (4) has an error range of 2-5%.
More comments (1) DE is not the mixed layer depth (hm). The latter also depends on past history, surface heat flux (heat balance) and the stability of the underlying water. In reality, DE < hm because hm can be affected by strong wind burst of short period. (2) Az = const and steady state assumptions are questionable. (3) Lack of data to test the theory. (The Ekman spiral has been observed in laboratory but difficult to observe in fields). (4) Vertically integrated Ekman transport does not strongly depend on the specific form of Az.
Progressive vector diagram, using daily averaged currents relative to the flow at 48 m, at a subset of depths from a moored ADCP at 37.1°N, 127.6°W in the California Current, deployed as part of the Eastern Boundary Currents experiment. Daily averaged wind vectors are plotted at midnight UT along the 8-m relative to 48-m displacement curve. Wind velocity scale is shown at bottom left. (Chereskin, T. K., 1995: Evidence for an Ekman balance in the California Current. J. Geophys. Res., 100, 12727-12748.)
Surface Drifter Current Measurements a platform designed to move with the ocean current
Ekman Transport Starting from a more general form of the Ekman equation (without assuming AZ or even a specific form for vertical turbulent flux) Integrating from surface z= to z=-2DE (e-2DE=0.002), we have where and are the zonal and meridional mass transports by the by the Ekman current. Since , we have
Ekman transport is to the right of the direction of the surface winds
Ekman pumping through the layer: Integrating the continuity equation Where and are volume transports. Assume and let , we have is transport into or out of the bottom of the Ekman layer to the ocean’s interior (Ekman pumping). , upwelling , downwelling Water pumped into the Ekman layer by the surface wind induced upwelling is from 200-300 meters, which is colder and reduces SST.
Coastal and equatorial upwelling Coastal upwelling: Along the eastern coasts of the Pacific and Atlantic Oceans the Trade Winds blow nearly parallel to the coast towards the Doldrums. The Ekman transport is therefore directed offshore, forcing water up from below (usually from 200 - 400 m depth). Equatorial Upwelling: In the Pacific and Atlantic Oceans the Doldrums are located at 5°N, so the southern hemisphere Trade Winds are present on either side of the equator. The Ekman layer transport is directed to the south in the southern hemisphere, to the north in the northern hemisphere. This causes a surface divergence at the equator and forces water to upwell (from about 150 - 200 m).
Cold SST associated with the coastal and equatorial upwelling
An example of coastal upwelling Note how all contours rise towards the surface as the coast is approached; they rise steeply in the last 200 km. On the shelf the water is colder, less saline and richer in nutrients as a result of upwelling. Water property sections in a coastal upwelling region, indicating upward water movement within about 200 km from the coast. (This particular example comes from the Benguela Current upwelling region, off the coast of Namibia.) The coast is on the right, outside the graphs; the edge of the shelf can just be seen rising to about 200 m depth at the right of each graph.
For convenience, assume the bottom of the sea is flat and located at z=0, the governing equation and its general solution are the same as the surface case. Ekman layer at the bottom of the sea Boundary conditions Z=0 (bottom of the sea) or As z- (into the interior) or
General solution: If z, VE0, i.e., A=0 If z=0, VE=-Vg=B We have Let
Solution For z0,
The direction of the total currents where The near bottom the total current is 45o to the left of the geostrophic current.
Transport at the top of the bottom Ekman layer Assume , the solution can be written as Using the continuity equation
We have Since
Given the integral i.e., The vertical velocity at the top of the bottom boundary layer Ekman pumping at the bottom.