Download

1 / 31
310 likes | 342 Views
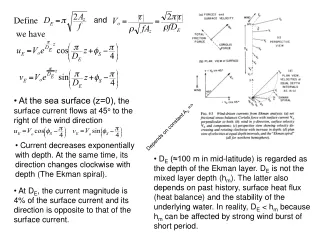
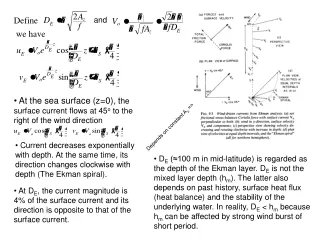
Define. and. we have. • At the sea surface (z=0), t he surface current flows at 45 o to the right of the wind direction. Depends on constant A z =>. • Current decreases exponentially with depth and. At the same time, its direction changes clockwise with depth (The Ekman spiral).

E N D
Define and we have • At the sea surface (z=0), the surface current flows at 45o to the right of the wind direction Depends on constant Az => • Current decreases exponentially with depth and. At the same time, its direction changes clockwise with depth (The Ekman spiral). • DE (≈100 m in mid-latitude) is regarded as the depth of the Ekman layer. DE is not the mixed layer depth (hm). The latter also depends on past history, surface heat flux (heat balance) and the stability of the underlying water. In reality, DE < hm because hm can be affected by strong wind burst of short period. , • At DE, the current magnitude is 4% of the surface current and its direction is opposite to that of the surface current. .
Other properties (1) Relationship between surface wind speed W and (Vo, DE). Wind stress magnitude ) ( , , (2) Relationship between W and DE. Ekman’s empirical formula between W and Vo. , outside ±10o latitude (3) There is large uncertainty in CD (1.3 to 1.5 x 10⁻³ ±20% for wind speed up to about 15 m/s). CD itself is actually a function of W. (4) has an error range of 2-5%.
More comments (1) DE is not the mixed layer depth (hm). The latter also depends on past history, surface heat flux (heat balance) and the stability of the underlying water. In reality, DE < hm because hm can be affected by strong wind burst of short period. (2) Az = const and steady state assumptions are questionable. (3) Lack of data to test the theory. (The Ekman spiral has been observed in laboratory but difficult to observe in fields). (4) Vertically integrated Ekman transport does not strongly depend on the specific form of Az.
Progressive vector diagram, using daily averaged currents relative to the flow at 48 m, at a subset of depths from a moored ADCP at 37.1°N, 127.6°W in the California Current, deployed as part of the Eastern Boundary Currents experiment. Daily averaged wind vectors are plotted at midnight UT along the 8-m relative to 48-m displacement curve. Wind velocity scale is shown at bottom left. (Chereskin, T. K., 1995: Evidence for an Ekman balance in the California Current. J. Geophys. Res., 100, 12727-12748.)
For K as a scalar Price 1994
Surface Drifter Current Measurements a platform designed to move with the ocean current
Ekman Transport Starting from a more general form of the Ekman equation (without assuming AZ or even a specific form for vertical turbulent flux) Integrating from surface z= to z=-2DE (e-2DE=0.002), we have where and are the zonal and meridional mass transports by the by the Ekman current. Since , we have
Ekman transport is to the right of the direction of the surface winds
Ekman pumping through the layer: Integrating the continuity equation Where and are volume transports. Assume and let , we have is transport into or out of the bottom of the Ekman layer to the ocean’s interior (Ekman pumping). , upwelling , downwelling Water pumped into the Ekman layer by the surface wind induced upwelling is from 200-300 meters, which is colder and reduces SST.
Coastal and equatorial upwelling Coastal upwelling: Along the eastern coasts of the Pacific and Atlantic Oceans the Trade Winds blow nearly parallel to the coast towards the Doldrums. The Ekman transport is therefore directed offshore, forcing water up from below (usually from 200 - 400 m depth). Equatorial Upwelling: In the Pacific and Atlantic Oceans the Doldrums are located at 5°N, so the southern hemisphere Trade Winds are present on either side of the equator. The Ekman layer transport is directed to the south in the southern hemisphere, to the north in the northern hemisphere. This causes a surface divergence at the equator and forces water to upwell (from about 150 - 200 m).
An example of coastal upwelling Note how all contours rise towards the surface as the coast is approached; they rise steeply in the last 200 km. On the shelf the water is colder, less saline and richer in nutrients as a result of upwelling. Water property sections in a coastal upwelling region, indicating upward water movement within about 200 km from the coast. (This particular example comes from the Benguela Current upwelling region, off the coast of Namibia.) The coast is on the right, outside the graphs; the edge of the shelf can just be seen rising to about 200 m depth at the right of each graph.
Cold SST associated with the coastal and equatorial upwelling
For convenience, assume the bottom of the sea is flat and located at z=0, the governing equation and its general solution are the same as the surface case. Ekman layer at the bottom of the sea Boundary conditions Z=0 (bottom of the sea) or As z-(into the interior) or
General solution: If z, VE0, i.e., A=0 If z=0, VE=-Vg=B We have Let
Solution For z0,
The direction of the total currents where The near bottom the total current is 45o to the left of the geostrophic current.
Transport at the top of the bottom Ekman layer Assume , the solution can be written as Using the continuity equation
We have Since
Given the integral i.e., The vertical velocity at the top of the bottom boundary layer Ekman pumping at the bottom.
Properties of Sea Water • What is the pressure at the bottom of the ocean relative to sea surface pressure? What unit of pressure is very similar to 1 meter? • What is salinity and why do we use a single chemical constituent (which one?) to determine it? What other physical property of seawater is used to determine salinity? What are the problems with both of these methods? • What properties of seawater determine its density? What is an equation of state? • What happens to the temperature of a parcel of water (or any fluid or gas) when it is compressed adiabatically? What quantity describes the effect of compression on temperature? How does this quantity differ from the measured temperature? (Is it larger or smaller at depth?) • What are the two effects of adiabatic compression on density? • What are t and ? How do they different from the in situ density? • Why do we use different reference pressure levels for potential density? • What are the significant differences between freezing pure water and freezing seawater?
Conservation laws • Mass conservation (continuity equation), volume conservation • Salt conservation (evaporation, river run-off, and precipitation) • Heat conservation (short and long-wave radiative fluxes, sensible and evaporative heat fluxes, basic factors controlling the fluxes, parameterizations) • Meridional heat and freshwater transports • Qualitative explanations of the major distributions of the surface heat flux components
Basic Dynamics • What are the differences between the centrifugal force and the Coriolis force? Why do we treat them differently in the primitive equation? • What is the definition of dynamic height? • In geostrophic flow, what direction is the Coriolis force in relation to the pressure gradient force? What direction is it in relation to the velocity? • Why do we use a method to get current based on temperature and salinity instead of direct current measurements for most of the ocean? • How are temperature and salinity information used to calculate currents? What are the drawbacks to this method? • What is a "level of no motion"? Why do we need a "level of known or no motion" for the calculation of the geostrophic current? (What can we actually compute about the velocity structure given the density distribution and an assumption of geostrophy?) • What are the barotropic and baroclinic flows? Is there a “thermal wind” in a barotropic flow? • What can you expect about the relation between the slopes of the thermocline depth and the sea surface height, based on a 1 and 1/2 layer model? • What factors determine the static stability?