Download
1 / 39
390 likes | 537 Views
Using Geographic Information Systems (GIS) and Other Mapping Tools in VR Programs. Todd Sink, Ph.D., Research Specialist II WV Division of Rehabilitation Services Pisnu Bua - Iam , M.A., Senior Manager WV Division of Rehabilitation Services Rhonda Young, M.A. University of Arkansas.

E N D
Using Geographic Information Systems (GIS) and Other Mapping Tools in VR Programs Todd Sink, Ph.D., Research Specialist II WV Division of Rehabilitation Services Pisnu Bua-Iam, M.A., Senior Manager WV Division of Rehabilitation Services Rhonda Young, M.A. University of Arkansas WV Division of Rehabilitation Services
WV Division of Rehabilitation Services Outline • Introduction • VR Management Perspectives on GIS • Background on geographic information systems (GIS) • Purpose • Goals • Identification of Potential Underserved and Unserved Areas • Summary • Details, step by step • Summary of GIS Strategy • Other GIS possibilities in VR • Other Mapping Tools in VR
WV Division of Rehabilitation Services Background on GIS • What is it? How does it work? • What are the benefits? • Who uses GIS? What is it used for?
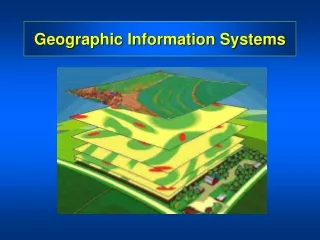
WV Division of Rehabilitation Services What is GIS? How Does it Work? GIS? Data Sources • A system designed to inform decision making from data
WV Division of Rehabilitation Services What are the Benefits? Benefits? Example: Tabular Data • Data • Capture • Store • Manage • Display • Analyze • Most efficient and effective for VR administrators • Ease with which data can be communicated
WV Division of Rehabilitation Services Who Uses GIS? What is it Used for? Who? Uses? • Government Agencies • Federal • State • Local • Real Estate • Health Care • Retail • Information • Others • Federal Government • Monitor predatory lending practices • State Government • Maintain highways and roads • Local Government • Establish evacuation routes • Track local crime patterns • Real Estate • Track property values and tax information • Health Care • Track spread of disease • Retail • Find optimal location for new store • Trade Area • Information • Planning of utility expansion
WV Division of Rehabilitation Services Purpose • Introduce GIS (ArcGIS: ArcMap 10) as a tool to pinpoint parts of West Virginia where populations are potentially unserved and possibly underserved by WVDRS • Discuss other mapping tools in VR
WV Division of Rehabilitation Services Goal • Improve planning for community outreach efforts • Cost-effective method to increase awareness of WVDRS programs and services among VR stakeholders and consumers
WV Division of Rehabilitation Services Identification of Potential Underserved and Unserved Areas Summary of Steps
WV Division of Rehabilitation Services Step 1. Determine scale for potential underserved and unserved areas (geographic area) Possible scales *Proposed RSA-911 requires VR agencies to report zip code information
WV Division of Rehabilitation Services Step 2. Create Zip Code Boundary Layer for State of West Virginia (WVDRS service area) Outline of Step 2
Navigate Network: 2.1.1 Click Add Data Button WV Division of Rehabilitation Services
Navigate Network: 2.1.2 Locate Folder with Data WV Division of Rehabilitation Services
Navigate Network: 2.1.3 Select U.S. Zip Codes WV Division of Rehabilitation Services
WV Division of Rehabilitation Services 2.2 Add U.S. Zip Codes
WV Division of Rehabilitation Services Create WV Zip Code Layer 2.3.1 Select by Attributes (WV)
Create WV Zip Code Layer 2.3.2 Create Layer from Selection WV Division of Rehabilitation Services
Create WV Zip Code Layer 2.3.3 Zoom to Layer WV Division of Rehabilitation Services
WV Division of Rehabilitation Services Step 3. Join WVDRS Active Client Table (As of 5-18-2011) with WV Zip Code Layer Outline of Step 3
WV Division of Rehabilitation Services Join Active Client List with Zip Code Layer: 3.1. Match Joining Columns
Join Active Client List with Zip Code Layer: 3.2.Perform Join WV Division of Rehabilitation Services
Join Active Client List with Zip Code Layer: 3.3 Validate Join WV Division of Rehabilitation Services
Join Active Client List with Zip Code Layer: 3.3 Validate Join cont. WV Division of Rehabilitation Services
WV Division of Rehabilitation Services Step 4. Operationalize Potential Underserved and Unserved Zip Codes • Potential Unserved Zip Codes • Ø active clients • Possible Underserved Zip Codes • Number of active clients below the state average, as of 5-18-2011 • Avg: 44.94
WV Division of Rehabilitation Services Step 5. Create Map of Active Clients Outline of Step 5
WV Division of Rehabilitation Services Create Map of Active Clients: 5.1 Data Classification
WV Division of Rehabilitation Services • Create Map of Active Clients: • 5.1 Data Classification cont.
Create Map of Active Clients: 5.2 Export Map WV Division of Rehabilitation Services
WV Division of Rehabilitation Services Summary • GIS application in VR • Improve planning for community outreach efforts • Other GIS Possibilities for State VR Agencies • Aid in matching employment needs of clients with available jobs • Match case management records with local employment dynamics data (U.S. Census) • Help find the most suitable location for a new branch office • Spatial Analyst Extension in ArcGIS • Input model criteria to define best location: Cost; accessibility; terrain; etc. • Explore patterns of success in employment outcomes • Explore by district office or branch office • Map best performers in terms of successful and unsuccessful closure statuses: • Model performance (Logistic regression or discriminant function analysis) using data from case management records and quality assurance review • Use results to mark areas where improvements could be made
The Others Purchased and Free software with mapping capabilities
Tableau (6.0 or 6.1)www.tableausoftware.com • Tableau Desktop • User Friendly • Dashboard Reporting • Connect directly to databases, data warehouses, files and spreadsheets • Data blending - connect to multiple data sources to add layers to the visualization • Automatic geocoding down to the zip code level • Tableau Reader is free and allows other VR agency staff to ‘see’ the data visualization • Training webinars are conducted on a regular basis and most are free • A 30 day trial is available • Pricing depends upon the number of user licenses
‘26’ Closures, FFY 2011, Field Services Office Locations The size of each mark represents the percentage of 26 closures for each of the ARS office locations.
JMP (9.0 or 9.02)www.jmp.com • JMP is a SAS product and has many capabilities: • Statistical analysis • Visualization • Modeling • Interactive data mining • Server connections are simple to use • JMP’s latest release, 9.0 has geographic maps or connect to a web map service • Add your own shapes, a building floor plan, scale diagrams and build your visualization • Graph builder is a tool and can be used to display density and contour graphs across multiple variables • Government pricing is available • Support and training are available on the website
JMP Tree Map 26 Closures, FFY 2011, Counselor, District, City The size of each box within the District, City represent numeric values for the number of cases
SPSS (20.0) • SPSS is an IBM statistical analysis product and the latest release includes mapping tools • Several maps are pre-loaded or this tool can be used
26 Closures, FFY 2011 by Office Zip SPSS Graphboard Template Chooser and map imported with the Map Building Utility
Free Software and Map Resources • GeoDa, open source software developed by Arizona State University, Mac OSX and Windows versions http://geodacenter.asu.edu/ • ArcGIS Explorer, free GIS viewer with access to ArcGIS online base maps and layers, Windows only http://www.esri.com/software/arcgis/explorer/ • ArcGIS Explorer Online, free browser based services, requires account creation, works with Explorer, Firefox and Safari http://explorer.arcgis.com
Where do I get those shape map files? TIGER Data – U.S. Census Bureau, 2010 data now available www.census.gov/geo/www/tiger/ QUESTIONS?


![Geographic Information System [GIS]](https://cdn2.slideserve.com/5315378/geographic-information-system-gis-dt.jpg)