Download
1 / 2
20 likes | 102 Views
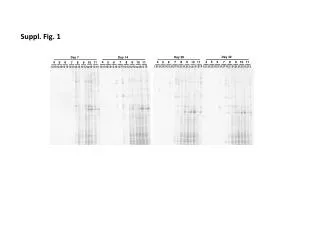
Suppl Fig. 2 CRM197 specific T cell responses as

E N D
Suppl Fig. 2 CRM197 specific T cell responses as determined by ELISPOT. Longitudinal assessment of IFN-γ responses to CRM-197 carrier protein. ELISPOT analysis was performed using PBMCs obtained at time points post Prevnar vaccination against the carrier protein CRM197. Composite plots for Arm 1 patients receiving no cyclophosphamide and Arm 2 no cyclophosphamide are depicted; note differences in y-axis scale. A reference line (black dotted line) indicating 50 spot forming cells is shown.