Download
1 / 23
230 likes | 236 Views
Air Pollution. Air Pollution. air pollution. air pollution represents the introduction new , unusual for air chemical , mechanical or biological substances. Major sources of air pollution. natural sources. Blow up volcanoes. mineral springs. forest fires.

E N D
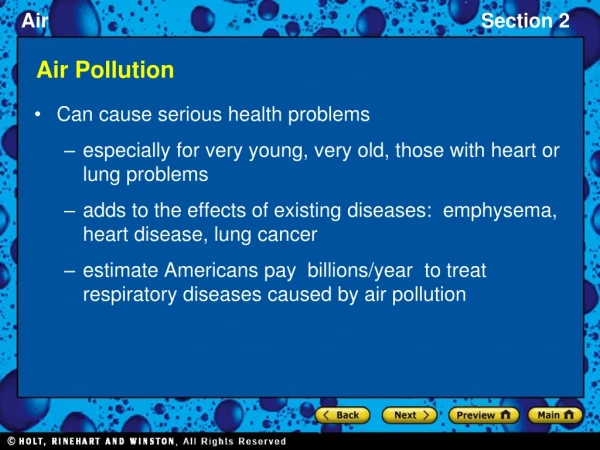
air pollution • air pollution represents the introduction new, unusual for air chemical, mechanical or biological substances.
Major sources of air pollution natural sources
Power plants, refineries, factories and other industrial plants
Global warming is the rise in the average temperature of Earth's atmosphere and oceans since the late 19th century and its projected continuation. Since the early 20th century, Earth's mean surface temperature has increased by about 0.8 °C (1.4 °F), with about two-thirds of the increase occurring since 1980.Warming of the climate system is unequivocal, and scientists are 95-100% certain that it is primarily caused by increasing concentrations of greenhouse gases produced by human activities such as the burning of fossil fuels and deforestation. These findings are recognized by the national science academies of all major industrialized nations. • Climate model projections were summarized in the 2007 Fourth Assessment Report (AR4) by the Intergovernmental Panel on Climate Change (IPCC). They indicated that during the 21st century the global surface temperature is likely to rise a further 1.1 to 2.9 °C (2.0 to 5.2 °F) for their lowest emissions scenario and 2.4 to 6.4 °C (4.3 to 11.5 °F) for their highest. The ranges of these estimates arise from the use of models with differing sensitivity to greenhouse gas concentrations. • Future climate change and associated impacts will vary from region to region around the globe.The effects of an increase in global temperature include a rise in sea levels and a change in the amount and pattern of precipitation, as well as a probable expansion of subtropicaldeserts.Warming is expected to be strongest in the Arctic, with the continuing retreat of glaciers, permafrost and sea ice. Other likely effects of the warming include more frequent extreme weather events including heat waves, droughts and heavy rainfall; ocean acidification; and species extinctions due to shifting temperature regimes. Effects significant to humans include the threat to food security from decreasing crop yields and the loss of habitat from inundation. • Proposed policy responses to global warming include mitigation by emissions reduction, adaptation to its effects, and possible future geoengineering. Most countries are parties to the United Nations Framework Convention on Climate Change (UNFCCC), whose ultimate objective is to prevent dangerous anthropogenic (i.e., human-induced) climate change. Parties to the UNFCCC have adopted a range of policies designed to reduce greenhouse gas emissions and to assist in adaptation to global warming.Parties to the UNFCCC have agreed that deep cuts in emissions are required, and that future global warming should be limited to below 2.0 °C (3.6 °F) relative to the pre-industrial level. Reports published in 2011 by the United Nations Environment Programme and the International Energy Agency suggest that efforts as of the early 21st century to reduce emissions may be inadequate to meet the UNFCCC's 2 °C target.
Observed temperatures changes • The Earth's average surface temperature rose by 0.74±0.18 °C over the period 1906–2005. The rate of warming over the last half of that period was almost double that for the period as a whole (0.13±0.03 °C per decade, versus 0.07±0.02 °C per decade). The urban heat island effect is very small, estimated to account for less than 0.002 °C of warming per decade since 1900. Temperatures in the lower troposphere have increased between 0.13 and 0.22 °C (0.22 and 0.4 °F) per decade since 1979, according to satellite temperature measurements. Climate proxies show the temperature to have been relatively stable over the one or two thousand years before 1850, with regionally varying fluctuations such as the Medieval Warm Period and the Little Ice Age. • Recent estimates by NASA's Goddard Institute for Space Studies (GISS) and the National Climatic Data Center show that 2005 and 2010 tied for the planet's warmest year since reliable, widespread instrumental measurements became available in the late 19th century, exceeding 1998 by a few hundredths of a degree. Estimates by the Climatic Research Unit (CRU) show 2005 as the second warmest year, behind 1998 with 2003 and 2010 tied for third warmest year, however, "the error estimate for individual years ... is at least ten times larger than the differences between these three years."The World Meteorological Organization (WMO) statement on the status of the global climate in 2010 explains that, "The 2010 nominal value of +0.53 °C ranks just ahead of those of 2005 (+0.52 °C) and 1998 (+0.51 °C), although the differences between the three years are not statistically significant..." Every year from 1986 to 2012 has seen world annual mean temperatures above the 1961-1990 average.Temperatures in 1998 were unusually warm because global temperatures are affected by the El Niño-Southern Oscillation (ENSO), and the strongest El Niño in the past century occurred during that year.
Temperature changes vary over the globe. Since 1979, land temperatures have increased about twice as fast as ocean temperatures (0.25 °C per decade against 0.13 °C per decade). Ocean temperatures increase more slowly than land temperatures because of the larger effective heat capacity of the oceans and because the ocean loses more heat by evaporation. The northern hemisphere is also naturally warmer than the southern hemisphere mainly because of meridional heat transport in the oceans which has a differential of about 0.9 petawatts northwards, with an additional contribution from the albedo differences between the polar regions. Since the beginning of industrialisation the interhemispheric temperature difference has increased due to melting of sea ice and snow in the North. Average arctic temperatures have been increasing at almost twice the rate of the rest of the world in the past 100 years, however arctic temperatures are also highly variable. Although more greenhouse gases are emitted in the Northern than Southern Hemisphere this does not contribute to the difference in warming because the major greenhouse gases persist long enough to mix between hemispheres.