Download
1 / 17
170 likes | 177 Views
Edge Turbulence in High Density Ohmic Plasmas on NSTX. K.M. Williams, S.J. Zweben, J. Boedo, R. Maingi, C.E. Bush NSTX XP Presentation Draft 5/25/06. Outline. Background XP Plan Diagnostic List. Motivation. How are these density limit phenomena* related to changes in edge turbulence ?

E N D
Edge Turbulence in High Density Ohmic Plasmas on NSTX K.M. Williams, S.J. Zweben, J. Boedo, R. Maingi, C.E. Bush NSTX XP Presentation Draft 5/25/06
Outline • Background • XP Plan • Diagnostic List
Motivation How are these density limit phenomena* related to changes in edge turbulence ? • disruptions • divertor detachment • poloidal detachment • increased edge transport *Greenwald, M. Plasma Phys. Control. Fusion 44 (2002) R27-R80 Study density limit in the simplest possible NSTX plasma, i.e. Ohmic plasmas, without momentum input and heating introduced by NBI. If the density limit can not be reached Ohmically, then add NBI if that will allow the density limit to be reached.
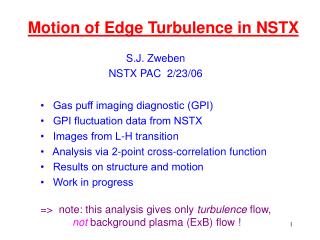
GPI setup on NSTX for 2006 • High speed imaging of edge plasma with Phantom 7 camera. (Maqueda) • Radial and poloidal information from chords Radial • The chords are arranged to detect light emitted poloidally and radially at the plasma edge. • The spatial resolution is 1-2cm • The 23cm x 23cm viewing area is imaged into a 800pixel x 1000 pixel coherent fiber bundle. • Each fiber images a 2cm diameter area of the plasma • The signals from the fiber optical cables are then digitized at 500kHz H1 H2 H3 T7 T6 T5 C T3 T2 T1 H5 H6 H7 Poloidal Shot#117939 @532ms
Results from NSTX Ohmic Density Scan • XP 203 (S.Kaye) showed that high densities (0.8 nG) could be achieved for Ohmic Deuterium plasmas after boronization. For He the Greenwald density is surpassed (1.1 nG) (Figure 1) • Little change was observed in edge turbulence in this scan (Zweben et al, Nucl. Fusion 2004) • However, the density limit was not reached in these Ohmic plasmas Figure 1*: Graph of line averaged density versus Greenwald density in Ohmic Helium and Deuterium plasmas before and after boronization. The post-boronization plasmas achieved higher densities *Sabbagh, S.A. et al, Nuclear Fusion Vol. 41, No. 11, (2001)
Results from NSTX NBI Density Scan • In XP 604, “Density Scan” by Boedo densities ≤ 1.2nG were achieved • Using the voltage signal from PMTs in the GPI system’s chord diagnostic, the relative fluctuation level I/I increases with increasing density. • The cross correlation coefficient between two nearby radial channels also increases with increasing density. This indicates an increase in the size of the turbulence as the density is increased.
Other Results on Density Limits • On DIII-D, intermittency increased with density but intermittent events carried a large fraction of local density at all radii and densities measured [1] • On C-Mod, as density increased blobs move in past the separatrix and edge plasma becoming intermittent [2] • Modeling of density limit is in progress based on blobs / intermittency [3] [1] Boedo, J. A. et al.,Phys. Plasmas V10, No 5, (2003) 1670-1677 [2] LaBombard, B. et al., Nucl. Fusion 45 (2005) 1658-1675 [3] D’Ippolito and Myra-PoP 2/06
What are the expected results? • The density scan may reveal some change in the edge turbulence as density exceeds Greenwald density in Ohmic plasmas. • Measurements from other diagnostics may also help to put together a picture of edge turbulence near the Ohmic density limit, i.e. reflectometer, Firetip, CHERS, Langmuir probes (scanning and fixed), ERD.
Desired Conditions in NSTX • A density scan in Ohmic, lower single null deuterium plasmas in 1/2 day at B=3.5kG and I=0.6 MA (current and field are consistent with GPI viewing angle). Constant outer gap = 5 cm • SGI and LFS (bay K) fueling required to increase density • If possible after boronization since it allows for higher densities to be reached in NSTX • 7.5 min He glow is also desired • A density range from 0.4G-1.3G (or higher) (nG=5.3x10¹⁹ m-3 @ 0.6 MA)
Experimental Run Plan • Reference shot #117762 [Ip=600kA, BT=3.5kG, ~1.7, outer gap=8cm, aspect ratio=1.3, flattop=250ms] • Shot list: • ~ 0.6 nG (1 shot to establish baseline same as 117762) • ~ 1.0 nG (1 shot, start with SGI plenum pressure of ~ 1200 Torr) • ≥ 1.2 nG (2 shots, raise SGI pressure to ~ 2000 Torr, add LFS fueling @ 50 Torr-L/s to SGI pressure of 2400 Torr to get higher densities if necessary) • if density limit is reached, repeat highest density cases and then reduce puff to repeat lower density cases • if density limit is not reached at highest possible gas injection, try same density scan with small amount of NBI • Total number = 8 good shots (approx 0.5 run day)
Diagnostics • GPI High Speed Camera (Maqueda) • Fast probe (Boedo) • Reflectometers (Kubota) • Divertor Langmuir probes (Bush) • Thomson scattering* (LeBlanc) • ChERS,ERD* (Bell) • Plasma TV (Bush) • Divertor fast camera (Roquemore) • *Desired but not required diagnostics
Planned Analysis • Standard EFIT/LRDFIT and TRANSP analysis • Chord and probe will be analyzed to determine the turbulence level, relative fluctuation, autocorrelation time, radial and poloidal correlation lengths as well as the intermittency at the increased density. • Blob frequency will also be characterized, from camera data, versus density, beam power and other parameters. • Analysis of turbulence data will be compared with data from L-mode and H-mode plasmas.