Download
1 / 16
160 likes | 330 Views
Motion of Edge Turbulence in NSTX. S.J. Zweben NSTX PAC 2/23/06. • Gas puff imaging diagnostic (GPI) • GPI fluctuation data from NSTX • Images from L-H transition • Analysis via 2-point cross-correlation function • Results on structure and motion • Work in progress

E N D
Motion of Edge Turbulence in NSTX S.J. Zweben NSTX PAC 2/23/06 • • Gas puff imaging diagnostic (GPI) • • GPI fluctuation data from NSTX • • Images from L-H transition • • Analysis via 2-point cross-correlation function • • Results on structure and motion • • Work in progress => note: this analysis gives only turbulence flow, not background plasma (ExB) flow !
viewing area ≈ 25x25 cm spatial resolution ≈ 1-2 cm Gas Puff Imaging (GPI) Diagnostic • Looks at Da line of neutral deuterium from a gas puff • View ≈ along B field line to see 2-D structure B view from center column see: R.J. Maqueda et al, Rev. Sci. Inst. 2003
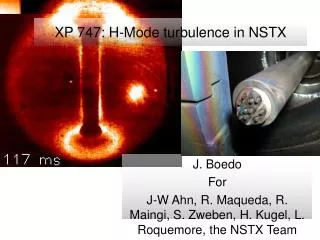
(b) camera images L H GPI gas puff separatrix chords limiter shadow GPI Fluctuation Data in NSTX • PSI-5 camera records 300 frames at ≤ 250,000 frames/sec with 64x64 pixels / frame => 1.2 msec of data per shot • Additional PM tube array digitized radial vs. poloidal array at 500,000 Hz => 64 msec of data per shot
GPI Images During L-H Transition • large data set of images from 2004 run (≥ 300 shots) • many on web: http://www.pppl.gov/~szweben/NSTX04
Analysis of Structure and Motion • Use simplest analysis via 2-point cross-correlation function of fluctuations in GPI light signals vs. space and time: C(x, t) = S0(t) Sx(t+t) t • Correlation length from FWHM of C(x, 0) [≈ 1.6 x Gaussian] • Velocity from time the delay of the peak in C(x, t) vs. x • C(x, t) averages over space and time spectrum of signals ~ ~
L - mode H - mode L @ L-H H @ L-H 2-D Turbulence Structure • Evaluated near radial peak of GPI signal ~ separatrix • No statistically significant changes from L- to H-mode Lrad (cm) Lpol / Lrad L 4.2±0.4 1.5±0.4 H 5.3±1.0 1.9±0.4
Vpol ≈ 1 km/sec/cm Vpol ≈ 0.5 km/sec/cm 4 shots 4 shots Poloidal Turbulence Motion • Average flow is generally in ion diamagnetic drift direction • Vpol gradient tend to be lower for H-mode than L-mode S.J. Zweben et al, to be published in Phys. Plasmas (2006)
disconnected (resistive- ballooning) C-Mod disconnected (resistive X-pt) collisionality connected (sheath- interchange) Vrad NSTX dimensionless blob size Comparison with “Blob Model” • Model for dynamics of isolated structures in SOL • Explains similar radial velocity on NSTX and C-Mod ~ 2 km/s in both C-Mod & NSTX Myra et al, Poster RP1.00019 Thursday PM (NSTX) Lodestar
Comparison with NSTX Data • Measure radial blob speed vs. time for one typical NSTX shot • Compare with theory using some assumptions (Myra APS ‘05) sheath-connected regime resistive ballooning regime
Bichoherence at L-H Transition • An increase in total bicoherence, suggesting an increase in coupling between low frequency flows and high frequency turbulence, was seen at L-H transition DIII-D (Moyer 2001) • The same analysis was applied to NSTX chord data, but no significant increase in bicoherence was observed at L-H. L H Total bicoherence #113732-113744 Anne White (UCLA) APS DPP ‘05 10
Work in Progress • Analysis of 2-D turbulence velocity fields vs. time • Tracking motion of coherent structures (blobs) • Getting new and better data from GPI on NSTX • Comparisons with theory and simulation • Comparisons with other experiments
2-D Turbulence Velocity Fields • Munsat (Colorado) has written codes to derive local velocity fields from images using ‘optical flow’ and ‘2-D tiling’ • But needs more work to complete comparison with 1-D CCF method (proposals not funded) • Stoltfus-Dueck (PPPL) trying alternate technique based on PCA (in progress) • Terry (MIT) wrote code to find 2-D time-averaged velocity fields (will apply to NSTX)
Tracking Motion of Blobs • Tracking blob motion is not the same as determining local turbulence velocity fields (blob tracking may be more relevant for determining radial transport) • Myra (Lodestar) has done tracking of local maxima of blobs in GPI images in a few shots (‘by hand’) • Maqueda (FP&T) has written a code to automatically track blobs with certain (arbitrary) selection criteria • Kamath (LLNL) is writing Sci/Dac/SAPP proposal to apply ‘advanced’ image processing and coherent structure algorithms to NSTX data
New Data from GPI on NSTX • Maqueda has new GPI camera which can record ≥ 100,000 frames/shot at up to 120,000 frames/sec • New tangential view near lower divertor should allow us to determine if blobs form there, and if so, which way they move (out in r or R ?) • New XP’s this year will focus on GPI measurements during density scan (Boedo) and Ohmic density limit (Williams)
Comparisons with Theory • Detailed comparisons of analytic ‘blob model’ with GPI images from specific shots (Myra et al, Lodestar) • Attempt to understand origin of blobs from first principles (Krommes, Stoltfus-Dueck, PPPL) • Attempt to compare GPI results with turbulence simulations - BOUT (Umansky, Xu, LLNL) - ESEL (Garcia, Naulin, Riso and Grulke, Greifswald) - GEM (Scott, Garching) • Plan to compare with CPES (Chang) and ESL (Cohen) (GPI data is available to compare with any theory or simulation)
Comparisons with Other Experiments • Alcator C-Mod - very similar diagnostic and generally similar results, as reported at APS, IAEA (Terry) • TJ-II stellarator (Madrid) - collaboration on developing GPI diagnostic and analysis of images (Hidalgo) • RFX (Padova) - collaboration starting this summer on GPI diagnostic and analysis (Scarin, Antoni) • JET (possibly) - discussions of GPI diagnostic and fast edge imaging (Gonsalves, Hidalgo) (many other collaborations/comparisons possible)