Download

1 / 34
340 likes | 506 Views
Feature Selection and Causal discovery. Isabelle Guyon, Clopinet André Elisseeff, IBM Zürich Constantin Aliferis, Vanderbilt University. Road Map. Feature selection. What is feature selection? Why is it hard? What works best in practice? How to make progress using causality?

E N D
Feature Selection and Causal discovery Isabelle Guyon, Clopinet André Elisseeff, IBM Zürich Constantin Aliferis, Vanderbilt University
Road Map Feature selection • What is feature selection? • Why is it hard? • What works best in practice? • How to make progress using causality? • Can causal discovery benefit from feature selection? Causal discovery
Causal discovery • What affects your health? • What affects the economy? • What affects climate changes? and… Which actions will have beneficial effects?
Feature Selection Y X Remove features Xi to improve (or least degrade) prediction of Y.
Uncovering Dependencies ? Factors of variability Actual Artifactual Known Unknown Unobservable Observable Controllable Uncontrollable
Predictions and Actions Y X See e.g. Judea Pearl, “Causality”, 2000
Anxiety Allergy Predictive power of causes and effects Smoking Smoking is a better predictor of lung disease than coughing. Lung disease Coughing
“Causal feature selection” • Abandon the usual motto of predictive modeling: “we don’t care about causality”. • Feature selection may benefit from introducing a notion of causality: • To be able to predict the consequence of given actions. • To add robustness to the predictions if the input distribution changes. • To get more compact and robust feature sets.
“FS-enabled causal discovery” Isn’t causal discovery solved with experiments? • No! Randomized Controlled Trials (RCT) may be: • Unethical (e.g. a RCT about the effects of smoking) • Costly and time consuming • Impossible (e.g. astronomy) • Observational data may be available to help plan future experiments Causal discovery may benefit from feature selection.
Individual Feature Irrelevance P(Xi, Y) = P(Xi) P(Y) P(Xi| Y) = P(Xi) density xi
1 ROC curve Sensitivity AUC 0 Specificity Individual Feature Relevance m- m+ -1 s- s+ 1
Univariate selection may fail Guyon-Elisseeff, JMLR 2004; Springer 2006
Multivariate FS is complex Kohavi-John, 1997 n features, 2n possible feature subsets!
FS strategies • Wrappers: • Use the target risk functional to evaluate feature subsets. • Train one learning machine for each feature subset investigated. • Filters: • Use another evaluation function than the target risk functional. • Often no learning machine is involved in the feature selection process.
Reducing complexity • For wrappers: • Use forward or backward selection: O(n2) steps. • Mix forward and backward search, e.g. floating search. • For filters: • Use a cheap evaluation function (no learning machine). • Make independence assumptions: n evaluations. • Embedded methods: • Do not retrain the LM at every step: e.g. RFE, n steps. • Search FS space and LM parameter space simultaneously: e.g. 1-norm/Lasso approaches.
In practice… • Univariate feature selection often yields better accuracy results than multivariate feature selection. • NO feature selection at all gives sometimes the best accuracy results, even in the presence of known distracters. • Multivariate methods usually claim only better “parsimony”. • How can we make multivariate FS work better? NIPS 2003 and WCCI 2006 challenges : http://clopinet.com/challenges
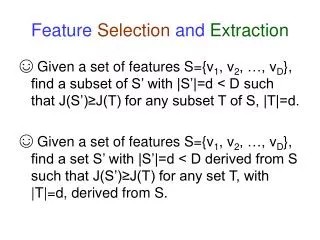
Definition of “irrelevance” • We want to determine whether one variable Xi is “relevant” to the target Y. • Surely irrelevant feature: P(Xi, Y |S\i) = P(Xi |S\i)P(Y |S\i) for all S\i X\i for all assignment of values to S\i Are all non-irrelevant features relevant?
Causal Bayesian networks • Bayesian network: • Graph with random variables X1, X2, …Xn as nodes. • Dependencies represented by edges. • Allow us to compute P(X1, X2, …Xn) as Pi P( Xi | Parents(Xi) ). • Edge directions have no meaning. • Causal Bayesian network: egde directions indicate causality.
Anxiety Markov blanket Smoking Lung disease Allergy Coughing A node is conditionally independent of all other nodes given its Markov blanket.
Relevance revisited In terms of Bayesian networks in “faithful” distributions: • Strongly relevant features = members of the Markov Blanket • Weakly relevant features = variables with a path to the Markov Blanket but not in the Markov Blanket • Irrelevant features = variables with no path to the Markov Blanket Koller-Sahami, 1996; Kohavi-John, 1997; Aliferis et al., 2002.
X2 || Y X2 || Y | X1 baseline (X2) health (Y) baseline x2 Y disease normal peak (X1) peak x1 Is X2 “relevant”? 1 P(X1, X2 , Y)= P(X1 | X2 , Y) P(X2) P(Y)
sample processing time X1 || Y X2 || Y X1 || X2 time (X2) health (Y) peak (X1) peak Are X1 and X2“relevant”? 2 Y disease normal P(X1, X2 , Y)= P(X1 | X2 , Y) P(X2) P(Y)
X1 || Y X2 || Y X1 || X2 X2 X1 X2 X1 X2 X1 Y Y Y XOR and unfaithfulness Y = X1 X2 X2 X1 Example: X1 and X2: Two fair coins tossed at random Y: Win if both coins end on the same side Y
y y X1 || Y | X2 X2 Simpson’s paradox x1 x1 … can make another one irrelevant Adding a variable… 3
y y X2=gender Female Male x1 x1 … conclusion: no evidence that eating chocolate makes you live longer. X1 || Y | X2 3 life expectancy Is chocolate good for your health? chocolate intake
y y Happy X2=mood Depressed x1 x1 … conclusion: eating chocolate may make you live longer! Really? 3 life expectancy Is chocolate good for your health? chocolate intake
X1 || Y | X2 X1 X2 Y X1 X2 Y X1 X2 Y Same independence relationsDifferent causal relations P(X1, X2 , Y) = P(X1 | X2) P(Y | X2) P(X2) P(X1, X2 , Y) = P(Y | X2) P(X2 | X1) P(X1) P(X1, X2 , Y) = P(X1 | X2) P(X2 | Y) P(Y)
gender (X2) X1 || Y | X2 mood (X2) life expectancy (Y) life expectancy (Y) chocolate intake (X1) chocolate intake (X1) Is X1 “relevant”? 3
time (X2) health (Y) baseline (X2) health (Y) life expectancy (Y) life expectancy (Y) peak (X1) peak (X1) mood (X2) gender (X2) chocolate intake (X1) chocolate intake (X1) Non-causal features may be predictive yet not “relevant” 1 2 3
X2 X1 Y x2 Y X2 X1 x2 x1 x1 Causal feature discovery P(X,Y) = P(X|Y) P(Y) P(X,Y) = P(Y|X) P(X) Sun-Janzing-Schoelkopf, 2005
Conclusion • Feature selection focuses on uncovering subsets of variables X1, X2, …predictive of the target Y. • Taking a closer look at the type of dependencies may help refining the notion of variable relevance. • Uncovering causal relationships may yield better feature selection, robust under distribution changes. • These “causal features” may be better targets of action.