Download
1 / 28
280 likes | 372 Views
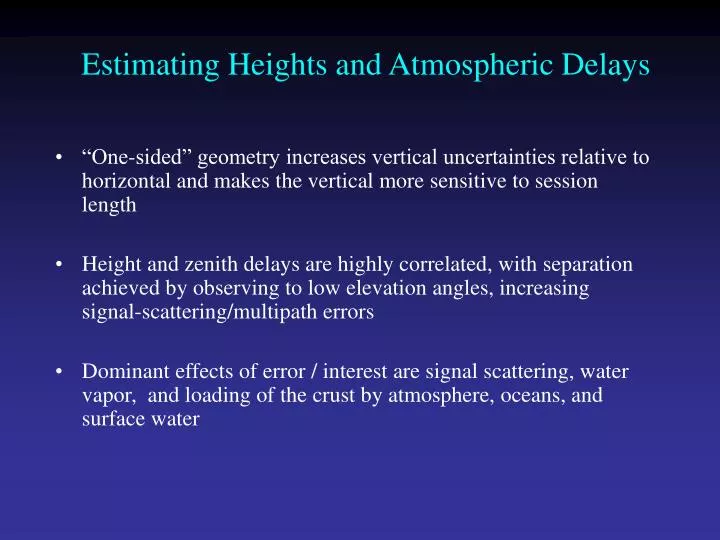
Estimating Heights and Atmospheric Delays. “One-sided” geometry increases vertical uncertainties relative to horizontal and makes the vertical more sensitive to session length

E N D
Estimating Heights and Atmospheric Delays “One-sided” geometry increases vertical uncertainties relative to horizontal and makes the vertical more sensitive to session length Height and zenith delays are highly correlated, with separation achieved by observing to low elevation angles, increasing signal-scattering/multipath errors Dominant effects of error / interest are signal scattering, water vapor, and loading of the crust by atmosphere, oceans, and surface water
Correlation between estimates of height and zenith delay as function of minimum elevation angle observed (VLBI, from Davis [1986])
Uncertainty in estimated height as function of minimum elevation angle observed (VLBI, from Davis [1986]; dotted line with no zenith delay estimated)
Time series for continuous station in (dry) eastern Oregon Vertical wrms 5.5 mm, higher than the best stations. Systematics of 25 mm peak-to-peak may be atmospheric or hydrological loading. This variation will maps into ZTD errors of ~10 mm if heights are held fixed.
Modeling Errors in GPS Vertical Estimates Unmodeled motions of the station Monument instability / local groundwater Loading of the crust by atmosphere, oceans, and surface water Signal propagation effects Signal scattering ( antenna phase center/multipath ) Atmospheric delay ( parameterization, mapping functions )
Monuments Anchored to Bedrock are Critical for Tectonic Studies (not so much for atmospheric studies) Good anchoring: Pin in solid rock Drill-braced (left) in fractured rock Low building with deep foundation Not-so-good anchoring: Vertical rods Buildings with shallow foundation Towers or tall building (thermal effects)
Modeling Errors in GPS Vertical Estimates Unmodeled motions of the station Monument instability / local ground water Loading of the crust by atmosphere, oceans, and surface water Signal propagation effects Signal scattering ( antenna phase center/multipath ) Atmospheric delay ( parameterization, mapping functions )
Annual Component of Vertical Loading Atmosphere (purple) 2-5 mm Snow/water (blue) 2-10 mm Nontidal ocean (red) 2-3 mm From Dong et al. J. Geophys. Res., 107, 2075, 2002
Atmospheric pressure loading near equator Vertical (a) and north (b) displacements from pressure loading at a site in South Africa. Bottom is power spectrum. Dominant signal is annual. From Petrov and Boy (2004)
Atmospheric pressure loading at mid-latitudes Vertical (a) and north (b) displacements from pressure loading at a site in Germany. Bottom is power spectrum. Dominant signal is short-period.
Spatial and temporal autocorrelation of atmospheric pressure loading Implies that for networks less than 1500 km, we get 80% cancellation of pressure loading ( < 1 mm in height, < 0.5 mm in ZTD) From Petrov and Boy, J. Geophys. Res.,109, B03405, 2004
Modeling Errors for Height and Atmosphere Unmodeled motions of the station Monument instability / local groundwater Loading of the crust by atmosphere, oceans, and surface water Signal propagation effects Signal scattering ( antenna phase center/multipath ) Atmospheric delay ( parameterization, mapping functions )
Modeling Antenna Phase-center Variations (PCVs) Ground antennas Relative calibrations by comparison with a ‘standard’ antenna (NGS, used by the IGS prior to November 2006) Absolute calibrations with mechanical arm (GEO++) or anechoic chamber May depend on elevation angle only or elevation and azimuth Adding a radome changes the model Errors for some antennas can be several cm in height estimates Satellite antennas (absolute) Estimated from global observations (T U Munich) Differences with evolution of SV constellation mimic scale change Recommendation for GAMIT: Use latest IGS absolute ANTEX file (absolute) with AZ/EL for ground antennas and ELEV (nadir angle) for SV antennas (MIT file augmented with NGS values for antennas missing from IGS)
Top: PBO station near Lind, Washington. Bottom: BARD station CMBB at Columbia College, California
Left: Phase residuals versus elevation for Westford pillar, without (top) and with (bottom) microwave absorber. Right: Change in height estimate as a function of minimum elevation angle of observations; solid line is with the unmodified pillar, dashed with microwave absorber added [From Elosequi et al.,1995]
Antenna Ht 0.15 m 0.6 m Simple geometry for incidence of a direct and reflected signal 1 m Multipath contributions to observed phase for three different antenna heights [From Elosegui et al, 1995]
Modeling Errors for Height and Atmosphere Unmodeled motions of the station Monument instability / local groundwater Loading of the crust by atmosphere, oceans, and surface water Signal propagation effects Signal scattering ( antenna phase center/multipath ) Atmospheric delay ( parameterization, mapping functions )
Modeling the Neutral Atmosphere in GPS Analysis Slant delay = (Zenith Hydrostatic Delay) * (“Dry” Mapping Function) + (Zenith Wet Delay) * (Wet Mapping Function) • ZHD well modeled by pressure (local sensors or numerical weather model) • Analytical mapping functions (NMF, GMF) work well to 10 degrees • ZWD cannot be modeled with local temperature and humidity - must estimate using the wet mapping function as partial derivatives • Because the wet and dry mapping functions are different, errors in ZHD can cause errors in estimating the wet delay (and hence total delay) .
Percent difference (red) between hydrostatic and wet mapping functions for a high latitude (dav1) and mid-latitude site (nlib). Blue shows percentage of observations at each elevation angle. From Tregoning and Herring [2006]. Effect of errors in a priori ZHD
Difference between a) surface pressure derived from “standard” sea level pressure and the mean surface pressure derived from the GPT model. b) station heights using the two sources of a priori pressure.c) Relation between a priori pressure differences and height differences. Elevation-dependent weighting was used in the GPS analysis with a minimum elevation angle of 7 deg.Tregoning and Herring [2006] Effect of error in a priori ZHD
Differences in GPS estimates of ZTD at Algonquin, Ny Alessund, Wettzell and Westford computed using static or observed surface pressure to derive the a priori. Height differences will be about twice as large. (Elevation-dependent weighting used). Tregoning and Herring [2006]
GAMIT Piecewise-linear Model for ZTD GPS adjustments to atmospheric zenith delay for 29 June, 2003; southern Vancouver Island (ALBH) and northern coastal California (ALEN). Estimates at 2-hr intervals. Linear spline model allows stochastic constraints on point-to-point estimates.
Estimating ZWD from GAMIT 1. Supply GAMIT with a priori ZHD accurate enough to avoid error from using the wet MF as partial derivative Error in ZTD (mm) = ~ 0.1 error in a priori ZHD (mb) --> 20 mb error (e.g GPT) = 2 mm error in ZTD (or ZWD) ( compare with a typical estimation error of ~5 mm ) 2. Read ZTD estimates from linear spline in o-file Error depends on rapidity of change of ZHD and ZWD and spacing of knots 3. Calculate ZWD = ZTD - ZHD where ZHD now must have the same accuracy you expect for ZWD, ~ 5 mm = 2 mb, best obtained from surface met, but closely matched by VMF1
Should you constrain coordinates (mainly heights) when estimating ZTD for PW studies ? Probably… Yes, if the noise noise is less than the uncertainties No, if there are significant unmodeled errors in the height variations
Slant ZWD for PW Studies Residuals from autcln (DPH files) are mostly water vapor and signal-scattering/multipath Multipath can be removed by averaging the residuals over days to weeks. (Program to do this is in preparation at MIT.)
References Bevis, M., S. Businger, S. Chriswell, T. A. Herring, R. A. Anthes, C. Rocken, and R. Ware, GPS meteorology: Mapping zenith wet delys onto precipitable water, J. Appl. Met., 33, 379, 1994 Boehm, J., B. Werl, and H. Schuh, Tropospheric mapping functions for GPS and very long baseline interferometry from European Centre for Medium Range Weather Forecasts operational data analysis, J. Geophys. Res, 111, B02406, doi:10.1029/2005JB03629, 2006. Boehm, J., R. Heinkelmann, and H. Schuh, Short Note: A global model of pressure and temperature for geodetic applications, J Geod, 81, 679, doi: 10.1007/s00190-007-0135-3, 2007. Boehm, J. A. Neill, P. Tregoning, and H. Schuh, Global Mapping Function (GMF): A new empirical mapping function based on numerical weather model data, Geophys. Res. Lett., 33, L07304, doi:10.1029/2005GL025546, 2006. Dong, D., P. Fang, Y. Bock, M. K.. Cheng, and S. Miyazaki, Anatomy of apparent seasonal vairation from GPS-derived site position time series, J. Geophys. Res., 107, 2075, doi:10.1029/2001JB000573, 2002. Elosegui, P., J. L., Davis, R. T. K. Jadlehag, J. M. Johansson, A. E. Niell, and I. I. Shapiro, Geodesy using the Global Positioning Sysems: The effects of signal scattering on estimates of site position, J. Geophys. Res., 100, 9921, 1995.
References (continued) Fratepietro, F., T. F. Baker, S. D. P. Williams, and M. Van Camp, Ocean loading deformations caused by storm surges on the northwest European shelf, Geophys. Res. Lett., 33, l06317, doi:10.1029/2005GL025475, 2006. Hagemann, S., L. Bengtsson, and G. Gendt, On the determination of atmospheric wter vapor from GPS measurements, J. Geophys. Res., 108, 4678, doi:10.1029/2002JD003235, 2003. Jade, S., and M. S. M. Vijayan, GPS-based atmospheric precipitable water vapor estimation using meteorological parameters interpolated from NCEP global reanalysis data, G. Geophys. Res., 113, D03106, doi: 10.1029/2007JD008758, 2008. Penna, N. T., M. A. King, and M. P. Stewart, GPS height time series: Short period origins of spurious long period signals, J. Geophys. Res., 111 doi:10.1029/2005JB0004047, 2006. Petrov and Boy, Study of the atmospheric pressure loading signal in very long baseline interferometry observations, J. Geophys. Res., 109, B03405, doi:10.1029/2003JB000250, 2004 Tregoning, P., and T. A. Herring, Impact of a priori zenith hydrostatic delay errors on GPS estimtes of station heights and zenith total delays, Geophys. Res. Lett., 33, L23303, doi:10.1029/2006GL027706, 2006. Watson, C., P. Tregoning, and R. Coleman, Impact of solid Earth tide models on GPS coordinate and tropospheric time series, Geophys. Res. Lett., 33, L08306, doi:10.1029/2005GL025538, 2006.