Download
1 / 17
170 likes | 233 Views
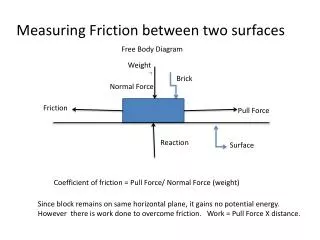
Measuring acoustic phase shifts between multiple atmospheric heights. Ruizhu Chen 1,2 & Junwei Zhao 2 1 . Dept. Physics, Stanford Univ., Stanford, CA 94305 2 Hansen Experimental Physics Laboratory, Stanford Univ., Stanford, CA 94305-4085. Motivation.

E N D
Measuring acoustic phase shifts between multiple atmospheric heights Ruizhu Chen1,2 & Junwei Zhao2 1. Dept. Physics, Stanford Univ., Stanford, CA 94305 2 Hansen Experimental Physics Laboratory, Stanford Univ., Stanford, CA 94305-4085
Motivation • Compute acoustic phase shifts (travel-time differences) between multiple heights in quiet regions, along the same ray path but traveling in opposite directions. One purpose is to examine whether the difference is related to evanescent waves. • Motivation • Data • Method • Results I3 & I0 LC &Ic LC & LW AIA • Summary ΦAB’ - ΦB’A :
Motivation • Compute acoustic phase shifts (travel-time differences) between multiple heights in quiet regions, along the same ray path but traveling in opposite directions. One purpose is to examine whether the difference is related to evanescent waves. • Investigate the orbital-velocity dependence of measured phase shifts. • Because center-to-limb measurements are also related to different line-formation heights, the main purpose of this work is to investigate whether multi-height is one cause of center-to-limb effect. • Motivation • Data • Method • Results I3 & I0 LC &Ic LC & LW AIA • Summary
Data 4 sets of data: (Higher and Lower, AB and A’B’) • I3 and I0 (original data before calibration on Vorbit) • Line core (LC) and continuum intensity (Ic) • Doppler proxies at line core (LC) and line wing(LW) • AIA 1600Å and 1700Å broad lines. • Motivation • Data • Method • Results I3 & I0 LC &Ic LC & LW AIA • Summary ΦAB’ - ΦB’A :
Data • 512 x 512 pixels; 0.06°/pix; 24 hrs long. • Each set of data is divided to five 8-hour intervals: 0-8h(++), 4-12h(+-), 8-16h(--), 12-20h(--), 16-24h(+-) • I3 and I0 Line core (LC) and continuum intensity (Ic) Doppler proxies at Line core (LC) and line wing(LW) AIA 1600Å and 1700Å broad lines • Motivation • Data • Method • Results I3 & I0 LC &Ic LC & LW AIA • Summary independent of Vorbit original calibrated proxy Orbital velocity for data used Line profile influenced by Vorbit
Measurement Procedure • Motivation • Data • Method • Results I3 & I0 LC &Ic LC & LW AIA • Summary phase change ΔΦ (d , w) Corss-correlation function f (t, d) A B’ B’ distance B’ B’ frequency A ΦAB’ - ΦB’A TAB’ - TB’A distance B’ B’ B’ B’ time
I3 and I0 ΦAB’ - ΦB’A = ΦI3 to I0 – ΦI0 to I3 • Formation height: 270 km (I3) and 20 km(I0) • 0-8h(++), 4-12h(+-), 8-16h(--), 12-20h(--), 16-24h(+-) • Motivation • Data • Method • Results I3 & I0 LC &Ic LC & LW AIA • Summary Frequency (mHz) Phase of cross spectrum Frequency (mHz) Distance (Mm) K Rsun
I3 and I0 • Motivation • Data • Method • Results I3 & I0 LC &Ic LC & LW AIA • Summary TAB’ - TB’A = TI3 to I0 – TI0 to I3 Time difference (s) ΦAB’ - ΦB’A = ΦI3 to I0 – ΦI0 to I3 Phase shift (rad) Distance (Mm)
Line core (LC) and continuum intensity(Ic) • Formation height: 270 km (LC) and 20 km(Ic) ΦAB’ - ΦB’A = ΦLC to Ic – ΦlC to Ic • Motivation • Data • Method • Results I3 & I0 LC &Ic LC & LW AIA • Summary Frequency (mHz) Phase of cross spectrum Frequency (mHz) Distance (Mm) K Rsun
Line core (LC) and continuum intensity(Ic) TAB’ - TB’A = TLC to Ic – TIc to LC Time difference (s) • Motivation • Data • Method • Results I3 & I0 LC &Ic LC & LW AIA • Summary ΦAB’ - ΦB’A = ΦLC to Ic – Φic to LC Phase shift (rad) Distance (Mm)
Line core (LC) and continuum intensity(Ic) 6mHz 3mHz 4mHz 5mHz 3.5mHz • Motivation • Data • Method • Results I3 & I0 LC &Ic LC & LW AIA • Summary TAB’ - TB’A – mean ( TAB’ - TB’A ) Time difference (s) 6mHz 3mHz 4mHz 5mHz 3.5mHz ΦAB’ - ΦB’A - mean ( ΦAB’ - ΦB’A ) Phase shift (rad) Distance (Mm)
Doppler proxy at line core and line wing • Formation height assumed same as line core and continuum: 270 km (LC) and 20 km(LW) • Motivation • Data • Method • Results I3 & I0 LC &Ic LC & LW AIA • Summary Doppler proxy: LW=(I0-I5)/(I0+I5) (Nagashima et al. (2014) LC=(I2-I3)/(I2+I3)
Doppler proxy: LW=(I0-I5)/(I0+I5) (Nagashima et al. (2014) LC=(I2-I3)/(I2+I3) Doppler proxy at line core and line wing • Formation height: 270 km (LC) and 20 km(Ic) ΦAB’ - ΦB’A = Φlc to lw – Φlw to lc • Motivation • Data • Method • Results I3 & I0 LC &Ic LC & LW AIA • Summary Frequency (mHz) Phase of cross spectrum Frequency (mHz) Distance (Mm) K Rsun
Doppler proxy at Line core and line wing TAB’ - TB’A = Tlc to lw – Tlc to lw Time difference (rad) • Motivation • Data • Method • Results I3 & I0 LC &Ic LC & LW AIA • Summary ΦAB’ - ΦB’A = Φlc to lw – Φlc to lw Phase shift (rad) Distance (Mm)
AIA 1600Å and 1700Å broad lines • Formation height: 480 km (LC) and 360 km(Ic) ΦAB’ - ΦB’A = Φ1600-1700 – Φ1600 to 1700 • Motivation • Data • Method • Results I3 & I0 LC &Ic LC & LW AIA • Summary Frequency (mHz) Phase of cross spectrum Frequency (mHz) Distance (Mm) K Rsun
AIA 1600Å and 1700Å broad lines TAB’ - TB’A = T1600 to1700 – T1700 to 1600 Time difference (rad) ΦAB’ - ΦB’A = Φ1600 to 1700 – Φ1700 to 1600 Phase shift (rad) • Motivation • Data • Method • Results I3 & I0 LC &Ic LC & LW AIA • Summary Distance (Mm)
Summary • Phase shifts from I3 and I0 are dominant by orbital velocity. Phase shifts from calibrated LC & Ic, and Doppler proxies at LC & LW, both have non-ignorable dependence on the orbital velocity. • Acoustic travel time (phase) between multiple heights is asymmetric with respect to directions. • ΦAB’ - ΦB’A for low frequencies are positive from line core & continuum intensity data, and negative from line core & line wing of Doppler proxy, AIA 1600Å & 1700Å data. It is unclear why is the sign different. • Waves of 6mHz don’t cut off, but always has a negative phase shifts. • Multiple formation heights will cause a phase shifts , which may be one cause center-to-limb effect. • Motivation • Data • Method • Results I3 & I0 LC &Ic LC & LW AIA • Summary