Download
1 / 14
140 likes | 382 Views
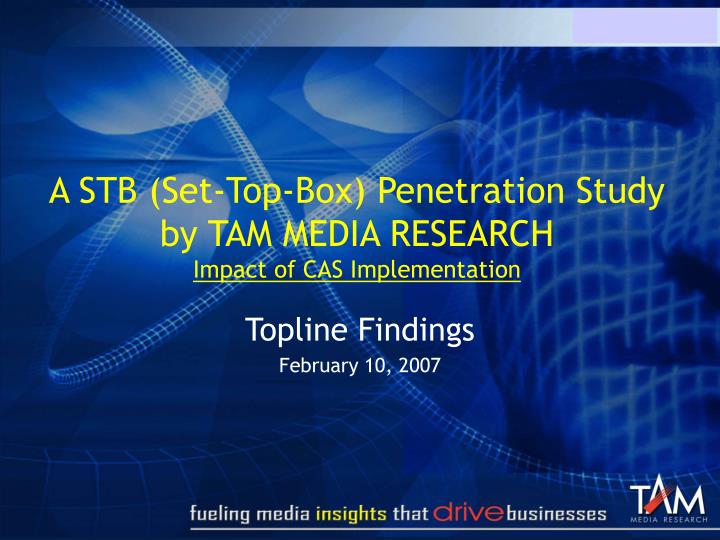
A STB (Set-Top-Box) Penetration Study by TAM MEDIA RESEARCH Impact of CAS Implementation. Topline Findings February 10, 2007. About. Come Jan 2007, CAS got implemented in the Zone-1 areas of Mumbai, Delhi & Kolkatta

E N D
A STB (Set-Top-Box) Penetration Studyby TAM MEDIA RESEARCHImpact of CAS Implementation Topline Findings February 10, 2007
About • Come Jan 2007, CAS got implemented in the Zone-1 areas of Mumbai, Delhi & Kolkatta • In the first week of the month, TAM commissioned AC Nielsen to conduct a ‘Pay TV Homes’ estimation study in the CAS-mandated zones of Mumbai, Delhi & Kolkatta • The fieldwork periods were – • Mumbai : 12th to 16th January, 2007 • Delhi : 11th to 15th January, 2007 • Kolkatta : 11th to 16th January, 2007 • The fieldwork mid-point : 14th January 2007
Methodology • This study was purposively limited to the CAS-mandated zones in the cities of Mumbai, Delhi & Kolkatta • The Zones were further divided into 100 sampling nodes, ensuring adequate geographical coverage of the Zones • Face-to-Face interviews using a structured questionnaire were conducted. The interviewee was the decision maker pertaining to cable subscription. • Sample Size = 750 respondents/city => 2,250 respondents across 3 cities • The fieldwork period was kept very tight & synchronized across the 3 metros, to ensure comparability
The footprint of CAS… • Of the 7.96 Mn cable homes across the 3 metros, 1.63 Mn cable homes fall under the CAS-mandated zones (approx. 21% homes fall under the mandated zones) • C&S Homes under the mandated areas, in the respective cities – • Mumbai : 17% (0.55Mn of the 3.25Mn cable homes) • Delhi : 26% (0.68Mn of 2.61Mn cable homes) • Kolkatta : 20% (0.41Mn of the 2.1Mn cable homes)
Scope of the study… • CAS adoption in the mandated zones of the respective cities • Profile of the ‘early adopters’ • Consumer Awareness
STB/DTH off-take… • Across the 3-metros… • Of the 16.33L homes covered by the CAS footprint, 2.77Lac homes had taken up a STB/DTH connection to access ‘pay channels’ • ‘Pay TV’ homes amounted to 17% of the CAS-mandated area • Off-take across the metros exhibit significant differences… • Mumbai – 1.39Lac of 5.48Lac (25% penetration) • Delhi – 0.97Lac of 6.76Lac (14% penetration) • Kolkata – 0.41Lac of 4.09Lac (10% penetration) *Homes under the CAS-mandated zones
Waiting in the wings… • Across the 3-metros… • An additional 1.98L homes claimed to have subscribed but awaiting installation of ‘pay TV services’ • An additional 12% cable homes waiting in the wings • The ‘under served’ segments varied by the respective metros… • Mumbai – 1.09L (20% awaiting installations) • Delhi – 0.43L (6% awaiting installations) • Kolkata – 0.46L (11% awaiting installations) *Homes under the CAS-mandated zones
Cumulatively… • Mumbai most responsive • 25% homes had converted • 20% awaiting installation • Delhi & Kolkatta response rates level, at an aggregate level • Delhi was better served (14%) than Kolkatta (10%) • At a 3-metro level… • 17% homes installed • 12% homes awaiting installation • Nearly 1/3rd of the mandated area responded favorably for conditional access to pay channels
Numerically speaking… • Of the 16.33L cable homes falling under the CAS-mandated zones across the 3 metros… • 2.77L homes had already opted for a STB/DTH connection(17%) • An additional 1.98L homes had subscribed but were awaiting for the installation (12%) • Cumulatively, 4.75L homes had subscribed comprising 29% of the CAS-mandated homes • At individual metro levels… • Mumbai – 1.39L homes installed + 1.09L awaiting installation = 2.48L homes subscribed • Delhi – 0.97L homes installed + 0.43L awaiting installation = 1.4L homes subscribed • Kolkatta – 0.41L homes installed + 0.46L awaiting installation = 0.87L homes subscribed
SEC-wise penetration… • The highest off-take is observed in the higher SEC & the off-take declines as one comes down the SEC ladder • The off-take levels vary significantly across markets even at a SEC level… • Highest off-take is observed in the SEC A strata of Mumbai & zero off-take in SEC D/E of Kolkatta • The response by Mumbais’ SEC C is nearly on par with those from SEC A residing in Delhi & Kolkatta • Owing to the pre-dominant non-responsive lower SEC, the off-takes seem to have got dampened significantly Base : Installed STB Subscribers
Awareness – Major ground to make… • Three areas were probed to check for awareness levels… • Knowledge of CAS-mandated areas • Requirement of a STB for viewing FTA channels • Rental schemes for STB’s • Despite low off-take in Kolkatta, consumer awareness appeared to be higher than in Delhi & Mumbai • Consumers residing in Delhi appeared to be the least aware of counter-parts from Mumbai & Kolkatta • Lets now see what the stated reasons for not buying into CAS… Base : All TV Homes
Pre-dominant reason – Pricing !!(among non-STB Homes) Base : Non-STB Subscribers
Summing Up… • Approximately, 21% of the cable homes in the 3-metros fell under the CAS-mandated area (Zone 1) • Off-take of the boxes was highest in Mumbai, followed by similar levels in Delhi & Kolkatta (Installed + Awaiting Installations) • A significant quantum of homes were awaiting installations (12% of 3-Metro C&S Homes) • The penetration of CAS had pre-dominantly taken off in the higher SEC’s of all the metros, zero off-take in the lowest SECs of Kolkatta • Consumer Awareness has significant ground to cover • Price, as expected, remained the pre-dominant reason amongst homes that had opted to remain FTA
Implications for TAM • TAM will continually conduct & publish results from its monthly STB-penetration studies and commensurate changes brought about in the panel