Download
1 / 20
200 likes | 361 Views
SPARC WAVAS-2 activity chairs: Cornelius Schiller, Thomas Peter, Karen Rosenlof SPARC Newsletter January 2008 https://sparch2o.icg.kfa-juelich.de/SPARCH2O/. Timing. Kick-off Bologna Sep 2008 Informal meeting Hawaii Oct 2008 Author meeting Toronto Mar 2009

E N D
SPARC WAVAS-2 activitychairs: Cornelius Schiller, Thomas Peter, Karen RosenlofSPARC Newsletter January 2008https://sparch2o.icg.kfa-juelich.de/SPARCH2O/
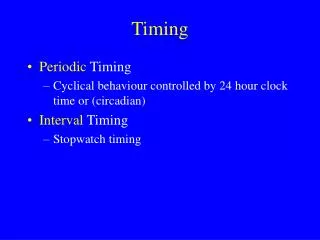
Timing Kick-off Bologna Sep 2008 Informal meeting Hawaii Oct 2008 Author meeting Toronto Mar 2009 Planning meeting Corsica Sep 2009 Next steps: Open SPARC data base end of 2009 Writing of chapters & papers Chapter meetings spring/summer 2010 Review end of 2010 Report completed mid 2011
Chapter Outline • Introduction • Data Quality • Supersaturation • UTS climatology and trends • Synthesis
2. Data quality(Schiller, Read) 2.1 Introduction 2.2 Listing and description of instruments, including list of missions 2.2.1 UTLS in-situ instruments (Schiller) 2.2.2 UTH instruments (NN) 2.2.3 Satellites (Read) 2.2.4 Remotes sensing ground-based (Schiller) 2.3 Field intercomparions (Pfister, Schiller, Vömel, Weinstock, Herman, Khaykin) 2.4 AquaVIT (Fahey, Gao, Möhler) Whitepaper/peer reviewed paper 2.5 Validation and comparison of remote sensing data sets (Read) 2.6 Derived quantities (2CH4+H2O, RHi, amplitudes …) 2.7 Summary/Assessment (Schiller, Read, NN, Fahey, Möhler, Pfister)
Data selection Criterion contribution to trends, supersaturation, or major validation instrument need to deliver data to data base Supersaturation CFH, HW, JLH, FISH, FLASH, APICT (AquaVIT) satellite/MOZAIC PDFs Trends stratosphere: HALOE + MLS (UARS/AURA), LIMS, SAGE-2, MIPAS-E, SCIAMACHY, ODIN, ACE, NOAA frostpoints, WVMS, MIPAS-B, MK-IV UTH: HIRS, SAGE-2, MLS, IASI, AIRS, LIDAR, MOZAIC, radio sondes, DLH SPARC WAVAS 2000
Atmospheric Water Vapor Intercomparison HW - CFH TC-4: tropics in Aug. 2007 1993-2007 6 Courtesy of Holger Vömel
AquaVIT2007: Core Instrument Accuracy 7 AquaVIT whitepaper, published https://aquavit.icg.kfa-juelich.de/AquaVit/
AquaVIT results and recommendations AquaVIT Findings • For 1-10 ppm, average deviations from reference within about ±10% • Absolute standard for multi-instrument calibration not yet developed, but APicT promising candidate • Differences between CFH and HWV are smaller than in field observations SPARC • Create a master intercomparison dataset of co-located insitu observations: aircraft, balloon, satellite • Document AquaVIT results in the SPARC assessment report Community • Conduct further coordinated intercomparisons of insitu measurements (< 20 ppm) on respective platforms • Develop in-flight performance criteria for insitu instruments regarding precision and accuracy limits and stability by Dave Fahey, Rushan Gao, Ottmar Möhler
3. Supersaturation(Peter, Koop) 3.1 Introduction (Peter, Koop, Gierens) 3.2 Basic concepts of microphysics (Baker, Peter, Krämer) 3.3 Cloud-scale coupled dynamics/microphysics(Spichtinger, Gierens, Jensen/Pfister, Murphy, Peter) 3.4 Laboratory studies of ice nucleation and growth (Murray, Möhler, Koop, Ebert, Saathoff) 3.5 Summary of field observations of relative humidity (Smith/Weinstock, Krämer/ Schiller, Troy/Herman, Khaykin, Vömel, Moyer, Fahey/Gao, Spichtinger/Gierens) 3.6 Critical discussion of mechanisms leading to supersaturation (all) 3.7 Implications of supersaturation (Kärcher, Forster, Gierens) 3.8 Conclusions (all) 3.9 Open issues: Recommendations for future work (all) review paper
Super-saturation puzzle – where we started 3 years ago SPARC workshop Karlsruhe 2007
Reanalysed data: How much evidence for unexplained data remains? FISH/FLASH revisited CFH revisited Re-analysis of JLH data in progress HU has no evidence for changes so far – remains the only striking data set? clear sky inside clouds Krämer et al., 2009
Microphysics • Low numbers of ice crystals - observed • Low surface areas and therefore slow uptake of water • Possible explanation for in cloud high humidity • Why are there low numbers? • Lab measurements: strong differences in behaviour below 200 K: • Cubic ice forms and persists • Accommodation coefficient changes • Glass forms (inorganic particles) • Vapour pressure measurements show abrupt scatter • Dynamics on cloud scale • Might be selective to favour only few particles to grow • E.g. large-scale updraught with high-frequency short waves
4. UTS climatology and trends (Rosenlof, Oltmans, NN) 4.1 Introduction 4.2 Upper tropospheric water (Oltmans, PIs of instruments involved) 4.2.1 Initial description of data used in this chapter 4.2.2 Distribution (2 and 3D, and also PDFs ... relation to clouds) 4.2.3 Periodic cycles (annual, ENSO, maybe QBO) 4.2.4 Trend capabilities 4.2.5 Discussion of measurement needs 4.3 Stratospheric water (Rosenlof, Oltmans, PIs of instruments involved) 4.3.1 Discussion on how to best construct climatology combining multiple data sets, or whether data quality assessments (chapter 2) indicate that it shouldn't be done at all 4.3.2 Distribution 4.3.2 Periodic cycles 4.3.3 Trends (and trend capabilities with a combined data set) 4.3.4 Discussion of measurement needs (maybe) 4.4 Summary and recommendations review paper
Water vapour / 30°S to 30°N / 25-35 km SAGE H2O anomaly [%] HALOE Odin/SMR Aura/MLS 1984-2008 - deseasonalized and combined data sets Ashley Jones - Chalmers [ACPD-2009]
(In)consistencies between data sets • What is the optimum time to publish WAVAS-2? • New retrievals (e.g. MLS/AURA, HALOE) and new data (e.g. ACE, SCIAMACHY) • Extension of data records (new satellites, after 2000 break)
UTH < 100 ppmv Problems: Large variability Large gradient Instrument accuracy
5. Synthesis(tbd) 5.1 Processes (Fueglistaler) 5.2 Radiation impact of changing H2O (Harries, Fu) 5.3 Projections and link to CCMVal (Gettelman)
Timing Kick-off Bologna Sep 2008 Informal meeting Hawaii Oct 2008 Author meeting Toronto Mar 2009 Planning meeting Corsica Sep 2009 Next steps: Open SPARC data base end of 2009 Writing of chapters & papers Chapter meetings spring/summer 2010 Review end of 2010 Report completed mid 2011