Download
1 / 23
230 likes | 233 Views
This workshop will explore the current state of emission inventories for prescribed and wildland fires, discuss the need for improved data quality and accessibility, and explore future directions for emissions inventory development. Relevant topics include data requirements, source apportionment, regulatory emissions goals, and carbon accounting.

E N D
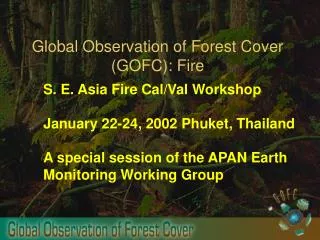
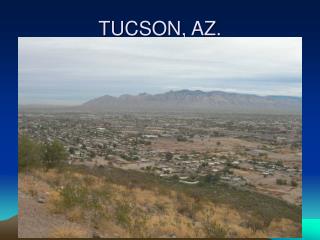
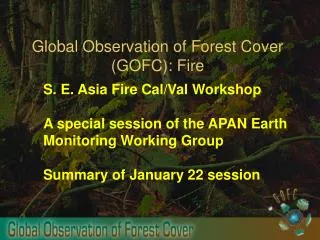
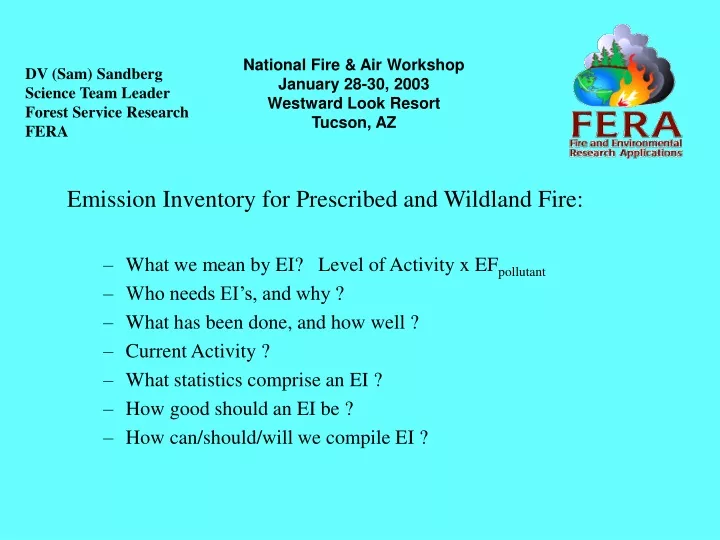
National Fire & Air WorkshopJanuary 28-30, 2003Westward Look ResortTucson, AZ DV (Sam) Sandberg Science Team Leader Forest Service Research FERA Emission Inventory for Prescribed and Wildland Fire: • What we mean by EI? Level of Activity x EFpollutant • Who needs EI’s, and why ? • What has been done, and how well ? • Current Activity ? • What statistics comprise an EI ? • How good should an EI be ? • How can/should/will we compile EI ?
References Available ? • EI Summary (2002) (Tom Battye/Tom Pace, EPA) • WRAPAir.org • GCVTC, Fire Emissions Project, 1996, 2018 Inventory (Air Sciences), Emission Tracking Policy, Natural Emissions, Emission Goals, ESMP.. • Others: • Smoke Management Guidebook (2002) (Hardy NWCG, EPA), • Fire Effects on Air (2003) (Sandberg JFSP) • Strategic Plan Fire and Air Information Systems (Express Team, NWCG) • FACA White Papers (Peterson, Sandberg, Leenhouts; EPA) • Historical perspective (Leenhouts 2001) • Emission Reduction (Peterson and Leenhouts)
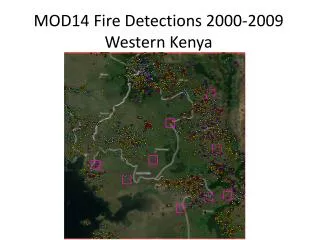
What’s happening now ? • WRAPAir Emissions Inventory (Air Sciences) • Other RPO’s (Vista….) • Real Time Fire Monitoring (Wei Min Hao, NFP) • 2 x Daily Modis satellite • NFDR fuel model x consumption constant • Natural and Anthropogenic Sources (Mckenzie & Sandberg, NFP) • 2064 projection (Climate, Land Use, Fuels Treatment, Ecosystem Health…) • Fuel Classification (FCC) and Emission Production (EPM v2) • BlueSky (Ferguson, NFP and JFSP) • Real-time emission and impact prediction • Washington and Oregon EI systems and PNW-GA support (1988) • Statistically valid defaults • Emission reduction parameters • Modeled consumption • Fastracs
What’s not happening now ? • Strategic Plan (Express) • Recommendation 4: Air quality impact assessment – Better wildland and prescribed fire information is needed to compile emissions inventories, for regional haze analysis and for determination of compliance. • Recommendation 8: National fire and air quality information database – A readily accessible source of information on past, current, and predicted future fire activity levels, emissions production, and air quality impacts from fires does not exist. Such a database is needed to analyze past experiences and replicate successes. • How accurately and precisely should we commit to providing an inventory of emissions from prescribed and wildland fires? • What is the appropriate mix of event reporting, ground-based data collection, modeling, remote sensing, and analysis to deliver an emissions inventory? • What national policy support do ask for to make it happen?
Case Study in Data Quality: WRAP Emissions Inventory • Data Requirements (defined by Regional Haze Rule) • 1996, Typical Year, 2018, 2064… • Annual and Five year increments • Daily emissions in order to focus on 20% • Data Requirement (defined by Smoke, CMAQ, Models3) • Hourly geo-referenced (or gridded) emissions rate • Plume rise: distribution of pollutant among 8 vertical strata ? • Criteria pollutants and chemical precursors ? • Data Available • Individual Wildfire Reports • Seasonal Prescribed Fire Estimates State daily inventories • FEP projections
Case Study in Data Quality: WRAP Emissions Inventory PM-2.5 Emissions199620181,547,661 T 1,620,072 TIncrease = 72,412 Tons (+5 %) from 1996
Who needs an EI? • Why do they need an Emission Inventory? • Source Apportionment “Pie” (State for SIP’s) • Regional Haze SIP’s and Tracking (EPA, States) • Regulatory Emissions “Goal” or “Cap” (per WA, OR, WRAP) • HAPs, Air Toxics, Hg, Risk assessments…. • Why do we need an Emission Inventory? • NEPA, FLM Responsibility • LMP, Fire Plans • Correlate Tracking with Monitoring, Source Apportionment • Accomplishment Monitoring “Give us Credit” • Demonstrate Emission reduction • Accomplish National Fire Plan goals • Wildland Fire Emission reduction • Carbon Accounting
What is an Emission Inventory Class? Emission Factor in class Vegetation Type Fuel Characteristics Fire Type Regulatory Status Geographic Area Time Period Lb ton-1 consumed x Acres burned in class x Fuel Loading Tons Consumed in class x Portion Consumed = Tons consumed
How Many Statistical Classes ? WRAP 1996 PM 2.5 • Emission Factor x Level of Activity • Statistical Representation of Each Emission Factor in class Lb ton-1 consumed x Tons Consumed in class What constitutes a class ? state or other geographic region ? regulated class ? prescribed, anthropogenic…? statistically different EF or LOA ? individual fire event ? portion of individual fire event ?
23 lb/ton (1972) PM2.5 Emission Factor in class Vegetation Cover (for EF and Fuel Character) Type of Burn (Pile, Wildfire, Broadcast….) Combustion Stage (Flame, Smolder, Residual) Statistically Different EF’s for:
Acres burned in class Acres Perimeter Accuracy, Unburned acres Severity Distribution (green, yellow, brown, black, ….) FrostFire Biscuit
x Portion Consumed -- Severity distribution -- Combustion stage weighting (EF and time period) -- Unreliability of direct estimates
Acres burned in class Final Report: Emission Inventories for WildlandFire(2002)
x Fuel Loading NFDRS Fuel Models
x Fuel Loading
Other Aerial Fuels Snag Tree Canopy Stratum Shrubs Needle Drape Low Vegetation Stratum Graminoids Herbs Piles, Jackpots and Windrows Stumps Woody Fuel Stratum Rotten Wood Sound Wood Lichen Moss, Lichen, Litter Stratum Litter Moss Ground Fuel Stratum Basal Accumulation Duff x Fuel Loading Shrub Stratum Fuelbed Strata and Categories
» 4 Fire Potential Classification 120 x Fuel Loading A consistent means of classifying fuelbed output for comparison and communication . FCC# 9 2 3 Mature lodgepole 9 Crowning 6 Potential 3 Mature 8 DF/hemlock 6 0 Pinyon /juniper Available Fuel 2 Potential 0 1 2 4 6 8 9 Sparse grass Sparse grass Dense grass Fire Behavior Potential
How good does an EI need to be? • Qualitative Assessment (Event, Summary statistics) • Variability ? • Scale of application ? • Absolute value or change ? • Plan, Predict, Real-Time, Long Term Projection • Goal of detection or accomplishment ? • Decision process (regulation, notification, action…) ? • Source Apportionment? • Quantitative assessment (not: “as good as possible”) • Value of information • Quality of information sources • Unexplained Variability
What needs to be done ? • Data Quality Assessment (Event, Summary statistics) • Daily event-specific record of accomplished acres by fuel type, burn type, and severity. 100 acres resolution per class, (95% compliance) • 0.5% statistical audit of reported accomplishment. (30%) • 0.5% statistical audit of remote-sensing and model outputs (30%) • 2-5% statistical measure of change variables (5%) • 1% sample of hourly profile of emission rate, plume rise (50%) • National commitment (policy, action) • Proactive delivery of planned, accomplished, and envisioned EI by class: • Vegetation, Source Class, Location, Land Use Class • Design efficient combination remote sensing, modeling, recording, auditing. • Honestly Implement Model and Remote sensing applications • Analysis of “what might have been” – i.e. Accomplishment reporting • Open communication of fire and emissions database • Incorporate analysis into LMP, operational decisions • Ten-year implementation deadline