Download
1 / 65
670 likes | 761 Views
Phase Equilibria and the Phase Rule. In most systems we usually encounter phases in coexistence. For example, a glass of ice water on a hot summer day comprises three coexisting phases: ice (solid), water (liquid), and vapor (gaseous). The Phase Rule.

E N D
In most systems we usually encounter phases in coexistence. • For example, a glass of ice water on a hot summer day comprises three coexisting phases: ice (solid), water (liquid), and vapor (gaseous).
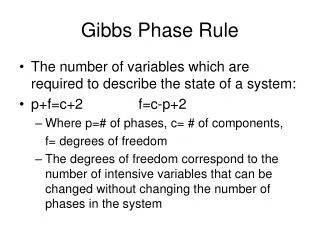
The Phase Rule • F is the number of degrees of freedom,it is the least number of intensive variables that must be fixed/known to describe the system completely. • C is the number of components and P is the number of phases present. • The number of components is the smallest number of constituents by which the composition of each phase in the system at equilibrium can be expressed in the form of a chemical formula or equation.
The number of components in the equilibrium mixture of ice, liquid water, and water vapor is one because the composition of all three phases is described by the chemical formula H2O.
Example: • water vapor confined to a particular volume. • F = 1 - 1 + 2 = 2 • Using the phase rule only two independent variables are required to define the system. • Because we need to know two of the variables to define the gaseous system completely, we say that the system has two degrees of freedom.
Therefore, even though this volume is known, it would be impossible for one to duplicate this system exactly (except by pure chance) unless the temperature, pressure, or another variable is known that may be varied independent of the volume of the gas. • Similarly, if the temperature of the gas is defined, it is necessary to know the volume, pressure, or some other variable to define the system completely.
Example: • a system comprising a liquid, water, in equilibrium with its vapor. • F = 1 - 2 + 2 = 1. • By stating the temperature, we define the system completely because the pressure under which liquid and vapor can coexist is also defined. If we decide to work instead at a particular pressure, then the temperature of the system is automatically defined.
Example: • we cool liquid water and its vapor until a third phase (ice) separates out. • F = 1 - 3 + 2 = 0 • Under these conditions, the state of the three-phase ice–water–vapor system is completely defined, and the rule gives ; in other words, there are no degrees of freedom.
as the number of components increases, so do the required degrees of freedom needed to define the system. • The greater the number of phases in equilibrium, the fewer are the degrees of freedom.
Examples: • Liquid water + vapor • Liquid ethyl alcohol + vapor • Liquid water + liquid ethyl alcohol + vapor mixture • (Note: Ethyl alcohol and water are completely miscible both as vapors and liquids). • Liquid water + liquid benzyl alcohol + vapor mixture • (Note: Benzyl alcohol and water form two separate liquid phases and one vapor phase).
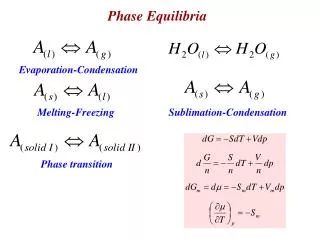
Systems Containing One Component • Consider a system containing one component, namely, water. • In the phase diagram of water, (the P-T (pressure–temperature) diagram): • The curve OA is the vapor pressure curve: • Its upper limit is at the critical temperature, 374°C for water, • its lower end terminates at 0.0098°C, called the triple point. • Along the vapor pressure curve, vapor and liquid coexist in equilibrium.
2. Curve OC is the sublimation curve: • vapor and solid exist together in equilibrium. 3. Curve OB is the melting point curve: • liquid and solid are in equilibrium. • The negative slope of OB shows that the freezing point of water decreases with increasing external pressure.
in any one of the three regions in which pure solid, liquid, or vapor exists and P = 1, F = 2. • Therefore, we must fix two conditions, namely temperature and pressure, to specify or describe the system completely.
Along any three of the curves where two phases exist in equilibrium, F = 1 . • Hence, only one condition need be given to define the system. • If we state that the system contains both liquid water and water vapor in equilibrium at 100°C, we need not specify the pressure, for the vapor pressure can have no other value than 760 mm Hg at 100°C under these conditions. • Similarly, only one variable is required to define the system along line OB or OC.
Finally, at the triple point where the three phases—ice, liquid water, and water vapor—are in equilibrium, we saw that F = 0.
Two-Component Systems Containing Liquid Phases • ethyl alcohol and water are miscible in all proportions. • water and mercury are, for all practical purposes, completely immiscible regardless of the relative amounts of each present. • Between these two extremes lies a whole range of systems that exhibit partial miscibility (or immiscibility).
One such system is phenol and water. • The curve gbhci shows the limits of temperature and concentration within which two liquid phases exist in equilibrium. • The region outside this curve contains systems having one liquid phase.
Starting at the point a, equivalent to a system containing 100% water (i.e., pure water) at 50°C, adding known increments of phenol to a fixed weight of water, the whole being maintained at 50°C, will result in the formation of a single liquid phase until the point b is reached, at which point a minute amount of a second phase appears.
The concentration of phenol and water at which this occurs is 11% by weight of phenol in water. • Analysis of the second phase, which separates out on the bottom, shows it to contain 63% by weight of phenol in water. • This phenol-rich phase is denoted by the point c on the phase diagram.
As we prepare mixtures containing increasing quantities of phenol, that is, as we proceed across the diagram from point b to point c, we form systems in which the amount of the phenol-rich phase (B) continually increases. • At the same time, the amount of the water-rich phase (A) decreases. • Once the total concentration of phenol exceeds 63% at 50°C, a single phenol-rich liquid phase is formed.
Temperature–composition diagram for the system consisting of water and phenol.
The maximum temperature at which the two-phase region exists is termed the critical solution, or upper consolutetemperature. • In the case of the phenol–water system, this is 66.8°C (point h ). • All combinations of phenol and water above this temperature are completely miscible and yield one-phase liquid systems.
The line bc drawn across the region containing two phases is termed a tie line; • it is always parallel to the base line in two-component systems. • all systems prepared on a tie line, at equilibrium, will separate into phases of constant composition. • These phases are termed conjugate phases.
Example 1: • a system at 50°C containing 24% by weight of phenol and 76% by weight of water (point d), at equilibrium we have two liquid phases present in the tube. • The upper one, A, has a composition of 11% phenol in water (point b on the diagram), • The lower layer, B, contains 63% phenol (point c on the diagram).
Phase B will lie below phase A because it is rich in phenol, and phenol has a higher density than water. • In terms of the relative weights of the two phases:
point b = 11%, • point c = 63% • point d = 24% • the ratio dc/bd = (63 - 24)/(24 - 11) = 39/13 = 3/1. • for every 10 g of a liquid system in equilibrium represented by point d, one finds 7.5 g of phase A and 2.5 g of phase B.
Example 2: • a system at 50°C containing 50% by weight of phenol (point f), • the ratio of phase A to phase B is fc/bf = (63 - 50)/(50 - 11) = 13/39 = 1/3. • for every 10 g of system f prepared, we obtain an equilibrium mixture of 2.5 g of phase A and 7.5 g of phase B.
Example 3: • a system containing 37% by weight of phenol will, under equilibrium conditions at 50°C, give equal weights of phase A and phase B.
Calculation of the composition of each phase in addition to the weight of the phases. • Example: we mixed 24 g of phenol with 76 g of water, warmed the mixture to 50°C, and allowed it to reach equilibrium at this temperature. • % phenol = 24/ (24+76) = 24%. • the ratio aqueous phase/phenolic phase = (63 - 24)/(24 - 11) = 39/13 = 3/1.
On separation of the two phases, we would find: • 75 g of phase A (containing 11% by weight of phenol). • 25 g of phase B (containing 63% by weight of phenol).
Phase A (aqueous) contains a total of: • (11 × 75)/100 = 8.25 g of phenol, • 66.75 g of water. • Phase B (phenolic) contains a total of: • (63 × 25)/100 = 15.75 g of phenol. • 9.25 g of water. • This gives a sum total of 24 g of phenol in the whole system. This equals the amount of phenol originally added.
with a two-component condensed system: • When one liquid phase is present, F = 3. (pressure, temperature and concentration to define the system). • When two liquid phases are present, F = 2; (pressure and temperature). • Note: pressure is fixed.
The phase diagram is used in practice to formulate systems containing more than one component where it may be advantageous to achieve a single liquid-phase product.
Phase diagram for the system triethylamine–water showing lower consolute temperature.
Nicotine–water system showing upper and lower consolute temperatures.
Two-Component Systems Containing Solid and Liquid Phases : Eutectic Mixtures • solid–liquid mixtures in which the two components are completely miscible in the liquid state and completely immiscible as solids. • Examples of such systems are: • salol–thymol, • salol–camphor, • acetaminophen–propyphenazone.
Phase diagram for the thymol–salol system showing the eutectic point.
there are four regions: • (i) a single liquid phase. • (ii) a region containing solid salol and a conjugate liquid phase. • (iii) a region in which solid thymol is in equilibrium with a conjugate liquid phase. • (iv) a region in which both components are present as pure solid phases.
Those regions containing two phases (ii, iii, and iv) are comparable to the two-phase region of the phenol–water system. • Thus it is possible to calculate both the composition and relative amount of each phase from knowledge of the tie lines and the phase boundaries.
As system x is progressively cooled, more and more of the thymol separates as solid. • As system y is cooled the solid phase that separates at 22°C is pure salol.
The lowest temperature at which a liquid phase can exist in the salol–thymol system is 13°C, and this occurs in a mixture containing 34% thymol in salol. • This point on the phase diagram is known as the eutectic point. • At the eutectic point, three phases (liquid, solid salol, and solid thymol) coexist.
The eutectic point denotes an invariant system because, in a condensed system, F = 2 - 3 + 1 = 0. • The eutectic point is the point at which the liquid and solid phases have the same composition (the eutectic composition). The solid phase is an intimate mixture of fine crystals of the two compounds.
Application of eutectic mixture • Lidocaine and prilocaine, two local anesthetic agents, form a 1:1 mixture having a eutectic temperature of 18°C. • The mixture is liquid at room temperature and forms a mixed local anesthetic that may be used for topical application.
Solid Dispersions • examples of solid dispersions: • Eutectic systems • solid solutions • molecular dispersions
the solid solutions: • a solid solute is dissolved in a solid solvent to give a mixed crystal. • the minor component or “guest” inserts itself into the structure of the “host” crystal taking advantage of molecular similarities and/or open spaces in the host lattice. • may exhibit higher, lower, or unchanged melting behavior depending upon the degree of interaction of the guest in the crystal structure.
The molecular dispersion of one component in another where the overall solid is amorphous. • Such mixed amorphous or glass solutions exhibit an intermediate glass transition temperature between those of the pure amorphous solids. • The dispersion of solid particles in semisolids is also a common dispersion strategy in which crystalline or amorphous solids are dispersed to aid delivery, as in some topical products.
Applications of solid dispersions • facilitating the dissolution and therefore, the bioavailability of poorly soluble drugs when combined with freely soluble “carriers” . • This increase in dissolution rate is due to: • reduction of particle size to an extent that cannot be readily achieved by conventional comminution. • increased wettability of the material, • reduced aggregation and agglomeration, • increase in solubility of the drug owing to the presence of the water-soluble carrier.
Three-Component Systems • In systems containing three components but only one phase, F = 3 - 1 + 2 = 4 for a noncondensed system. • The four degrees of freedom are temperature, pressure, and the concentrations of two of the three components. • Only two concentration terms are required because the sum of these subtracted from the total will give the concentration of the third component.