Download
1 / 33
340 likes | 499 Views
Group Differences: The Sequel. Last time. Last week we introduced a few new concepts and one new statistical test: Testing for group differences Degrees of Freedom 95% Confidence Intervals Independent Samples T-Tests

E N D
Last time • Last week we introduced a few new concepts and one new statistical test: • Testing for group differences • Degrees of Freedom • 95% Confidence Intervals • Independent Samples T-Tests • Tonight we’ll continue this discussion and take a look at the other types of t-tests • As we move forward, make sure you understand the appropriate situation in which to use these tests • Front cover of Cronk book, ‘Statistics Coach’ in SPSS
T-tests • Independent samples t-test = • Compares the means scores of two different groups of subjects • i.e., are science scores different between high fitness and low fitness • One-sample t-test = • Compares mean of a single sample to known population mean • i.e., group of 100 people took IQ test, are they different from the population average? Do they have above average IQ? • Paired-samples t-test = • Compares the mean scores for the same group of subjects on two different occasions • i.e., is the group different before and after a treatment? • Also called a dependent t-test or a repeated measures t-test • In all cases TWO group means are being compared
Recall • Independent t-tests are used when we have sampled two, different groups • ‘Independent’ is used to describe these tests because the two groups we sampled are independent of each other • No person can be in BOTH groups at the same time • Also known as ‘unpaired’ t-tests • One sample t-tests and paired-samples t-tests are similar, but are used for slightly different set-ups
One-Sample T-tests • One-sample t-tests are used when: • You have sampled one group and… • You want to know if that group is different from the population • The mean of the population has to be known beforehand • For the sake of example, we’re going to use IQ • We’ve discussed this before…
Example with IQ • Imagine I want to know if ISU undergraduate students have ‘above average intelligence’ • ‘Above average intelligence’ really means ~ have an IQ above the population mean/average • I’m NOT comparing these students to just another group, I want to compare these students to EVERYONE in the population (world) • To do this… • I take a random sample of 30 ISU undergraduates • All 30 student take an IQ test • Let’s take another look at IQ in the population…
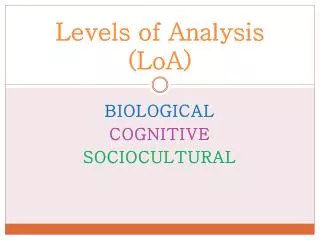
Recall that IQ is a standardized intelligence test The mean of the population is 100 If everyone in the world was tested, the average would be 100 X = 100 SD = 15 145 55 70 85 100 115 130
So, what I really want to know is: Does the average ISU student have an IQ above 100? The one-sample t-test will make this comparison and provide p X = 100 SD = 15 145 55 70 85 100 115 130
Move the independent variable into the “Test Variable” • In this case, our ISU student IQ variable • Now, we provide the population mean in the “Test Value” box so SPSS knows what to test against • Recall, the population mean of IQ is 100
Hypotheses • HO: ISU students average IQ is 100 • HA: ISU students average IQ is not/is above 100 • Notice that I’m comparing two groups – • ISU students • The population (the world) • Only using 1 sample – hence the ‘one sample’ t-test
Results • Notice: • t, df, p-value • Mean difference = ISU Students – Population Mean • df = 30 subjects – 1 group = 29 • 95% Confidence interval does not include 0 • We can be confident ISU students have above average IQ
Results in writing • The one-sample t-test revealed that ISU students have an above average IQ, by approximately 4.3 points (t = 2.62, 29). This difference is statistically significant (p = 0.014).
One-Sample T-test • Only used when comparing a sampled group to a known population mean • Must use prior research to determine the population mean • For example, you could NOT use this test to compare ISU students to IWU students • Instead, to compare two groups that are unrelated you should use a…?
One-Sample T-test Example ?’s • Is ISU basketball game attendance different than the MVC league average? • Do kids in Bloomington-Normal have a higher BMI’s than all kids in the US? • Do ISU baseball pitchers throw faster than the average MLB pitcher? • Is the average annual cost of living higher in Bloomington-Normal than the rest of the US? One-Sample T-test questions?
T-tests • Independent samples t-test = • Compares the means scores of two different groups of subjects • i.e., are science scores different between high fitness and low fitness • One-sample t-test = • Compares mean of a single sample to known population mean • i.e., group of 100 people took IQ test, are they different from the population average? Do they have above average IQ? • Paired-samples t-test = • Compares the mean scores for the same group of subjects on two different occasions • i.e., is the group different before and after a treatment? • Also called a dependent t-test or a repeated measures t-test • In all cases TWO group means are being compared
Paired Samples t-test • So far we’ve only been concerned with cross-sectional analysis of data • One measurement at one time point • However, for longitudinal data we have to run a different type of statistical test • For example, when we want to know if a variable in a group has changed from Time 1 to Time 2 (pre to post) • Known as ‘repeated measures’ • Because we measured the group once…then repeated it…
Example of Repeated Measures • Pretend I create a weight loss program called P90Y • I want to design a study to see if the program works • I only have enough money for 30 people to participate • I have two options from here: • 1) I can recruit 30 people, split them into two groups, and half of them get the P90Y program and half don’t • I compare their body weight after half use the program • I’d have two groups of 15 instead of one group of 30 • My statistical power has decreased, my chance of Type II error has increased (remember, df would equal 28, 30 – 2 groups) • Plus, the two groups of 15 people are different people • Ideally, I’d want to compare the same people on and off the program to remove individual variability
Example of Repeated Measures • Pretend I create a weight loss program called P90Y • I want to design a study to see if the program works • I only have enough money for 30 people to participate • My other option… • 2) I can recruit 30 people and put all 30 of them on the program • Now my statistical power is as strong as possible • Df = 29, 30 - 1 • Instead of being compared to another person, now my subjects will be compared to themselves at the start of the program • This is the true strength of using repeated measures
Drawback • The only drawback to using a repeated measures design in this scenario is that I will not be able to use an independent samples t-test to examine the data • Why? Because the ‘two’ groups I want to test are NOT independent. • Comparing 30 people at Time 1 to the same 30 people at Time 2 • They are related • You can NOT use a statistical test designed for independent samples on related groups
Paired Sample T-test • Be careful how you structure your data in SPSS, here is an example from our P90Y experiment
Data File • Notice: • The subject line indicates each individual subject • The two variables have been named as “Time 1” and “Time 2” • Could also use “pre-” and “post-test”, etc… • As you can see, some subjects lost weight on the program (some more than others, and some gained weight) • No grouping variable – they are all in the same group!
Notice the box on the left says “Paired Variables” • Move over your pre- and post-test measurements, for the same variable, into the boxes in the same line
Weight at Time 1 Weight at Time 2
Output • Normal t-test output, providing the mean, N, and SD • Notice that SPSS makes it ‘seem like’ you are comparing 2 groups • This is why repeated measures statistics should be used instead of independent samples (it’s like having a bigger sample size)
Output • For paired-samples t-tests, SPSS also provides a correlation between the two variables • This correlation should always be strong – since you’re correlating the same variable within the same people!!
T-test output • ‘Mean’ = Mean difference (Time 1 – Time 2) • 95% Confidence Interval • t • df = 29 (30 – 1 group) • P = 0.005 • P90Y works!!!
Results in writing… • A repeated measures t-test revealed that the group lost an average of 2.9 lbs over the course of the experiment (t = 3.03 (29)). This difference was statistically significant (p = 0.005).
Also… • To use the paired-samples t-test you do not always have to use a repeated measures design (like in our example) • In some instances, researchers select two groups that are ‘matched’ or ‘paired’ based on some specific characteristic • This is less common, but it simulates a true repeated measures test when it is not possible • For example…
Paired Samples Alternatives • Imagine researchers develop a drug designed to reduce the number of asthma attacks an asthmatic child has over a 6 month period • A true repeated measures design would take a year • 6 months without the drug and 6 months with the drug • Instead, they gather two groups of children with asthma and pair them based on characteristics like age, gender, height, asthma severity, etc… • Basically, they hand pick a control group to be very similar to their experimental group
Paired Sample Alternative • Now, they can complete the drug trial in 6 months and still have a suitable control group • It is NOT as strong as a true ‘repeated measures’ design, but it is better than nothing • You still have to use a repeated measures test – since you have created two groups that are related to each other (NOT independent) • This is why SPSS uses the term “Paired samples” t-test instead of “repeated measures”. The test can be used for either design. QUESTIONS on t-tests?
Upcoming… • In-class activity • Homework: • Cronk complete 6.2 and 6.4 (you did 6.3 last week) • Holcomb Exercises 40 and 41 • More testing for group differences next week! • ANOVA!!