Download
1 / 38
380 likes | 512 Views
Uses for OnTheMap. Economic Planning & Time Series - Where is the labor supply located? - Which industries are growing or declining over time? Transportation planning & analysis - Between which areas do workers commute? Emergency management

E N D
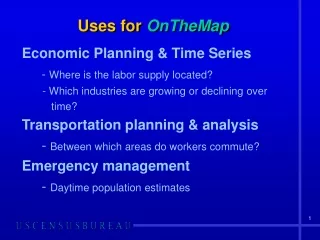
Usesfor OnTheMap Economic Planning & Time Series - Where is the labor supply located? - Which industries are growing or declining over time? Transportation planning & analysis - Between which areas do workers commute? Emergency management - Daytime population estimates
OnTheMap Mapping Missouri Tornado Path F-Scale: F3 between Clever and Nixa Path Length: ~40 miles Width: 1/4 to 1/2 mile Time: 10:08 – 11:00 P.M. *Source: National Weather Service
OnTheMap: Where People Go to Work Where do people who live in the path of the tornado work?
OnTheMap: Where Workers Live Where do workers employed at jobs located in the path of the tornado live?
OnTheMapLED’s online dynamic mapping tool REVISE • 42 states online • User-selected areas • Geographic layers such as community colleges and zip codes • OTM v 3 (Beta) released June 1; full version to be released on August 31 with up to 4 new states and 2002 – 2006 data • Where do workers live? • Where do residents work? • Reports on age, earnings, and industries with three years of data • Cross-state flows
Caveats About Beta ….. • OnTheMap Version 3 Beta is for testing new features and capabilities only. • There are known bugs. Not all geographic layers, years of data, states and functions are available in the Beta release. • OnTheMap Version 3 Beta data may not be reliable. Use OTM Version 2 for analytical purposes (until August 31, 2008).
4 Steps for Creating OTM Maps and Reports • Choose geographic layers you wish to show on your map • Select from available data options (years, job type, labor segment) • Define geographic study area • Pick analysis type
Selecting Your Basic Geography Type in the name or number of any of the areas shown in the dropdown box.
The Control Panel Map Key = Legend, Scale Layers = Add/Remove Map Features Search = Find Your Area
The Control Panel: Setting Your Choices Analysis = Select Data, Select Area(s), Set Map/Report Type
1. Data Settings Data Settings = Select Home or Work, Year(s), Job and Worker Type Coming Attraction! Select Workers by Age, Wage or Industry Cluster
Home/Residential Areaor Workplace Area Home Area -- Where workers live Workplace Area -- Where workers work Live or Work limits report options
Where, When, Which, Who Study Area Year Job Type Worker Characteristics
2. Study Area Selection Study Area = Select by Layer (City, County, WIA, ZIP Code), Freehand, etc. New Features! Donuts, Plumes
Freehand Selection Option New Feature! Modify freehand, buffer, plume, etc.
4. Choosing Map and Report Type Map/Report = Profile of workers in selected area or travel patterns of workers
Definitions: Area Profile and Shed Analysis Area Profile Analysis - a report and map showing the characteristics, location and distribution of workers living or working inside the selected study area Shed Analysis - a report and map showing where people work who live in the selected area (“Commute Shed”) or where workers live who are employed in the selected area (“Labor Shed”)
Definition: Rollup Areas Rollup areas - aggregates information on workers by selected boundary layers; can select three areas (defaults are cities/towns, counties and states) New Feature! Results by ZIP Codes, WIAs, Congressional Districts
The Results Tab Animate with Points and/or Thermals Output to HTML, XLS, PDF
Time Series Animation: Points and Thermals 2003 2002 2004
OnTheMap Reports • Area Profile: for Home Area or Work Area; show workers’ age, wage ranges, and industry; only Work Area profile report includes 10 Quarterly Workforce Indicators • Commute Shed: shows where residents of the study area work • Labor Shed shows where those who work in the study area live
Home Area Profile Report Age and Wage Ranges Employment Sectors Data Selections and Sources
Work Area Profile Report Age and Wage Ranges Quarterly Workforce Indicators (QWI) Employment Sectors Data Selections and Sources
Commute Shed Report Top 10 Cities/Towns Top 10 Counties Data Selections and Sources Top 5 States
Labor Shed Report Top 10 Cities/Towns Can select different “rollups” including ZIP Codes, WIBs Top 10 Counties Top 5 States
OnTheMap Version 3 Schedule • Version 3.0 Beta through July 21, 2008 • Expanded set of states; improved points/thermals and selection tools; expanded Place Name Lookup; new time-series animation; improved Text Only tool • Version 3.0, release Aug. 31, 2008 • 2005 and 2006 data; improved origin/destination data; updated cartography and base map vintage (TIGER 2006); full cross-state analyses • Version 3.1, release Sept. 30, 2008 • Expanded reporting and data output options (labor market segments); enhanced on-screen documentation
Keep in Mind… • LED not yet national in scope. • LED does not yet include military, self-employed or federal workers. • Data in OnTheMap refreshed annually.
Contact Us • Local Employment Dynamics • http://lehd.did.census.gov • Please send your Beta Tester comments • with “OnTheMap Version 3” in subject line to: • DID.Local.Employment.Dynamics@census.gov. • Join the OnTheMap ListServ • lehd-onthemap@lists.census.gov