Download
1 / 16
160 likes | 277 Views
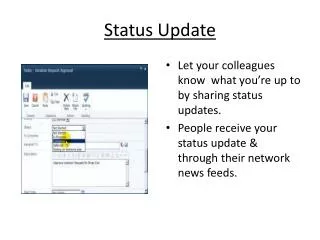
System Status Update. February 2012. Overview. Review of year to date demand and energy Review of recent system performance Outlook for summer 2012 What is being done to meet the challenges. Weekly peak demand.

E N D
System Status Update February 2012
Overview • Review of year to date demand and energy • Review of recent system performance • Outlook for summer 2012 • What is being done to meet the challenges
Weekly peak demand • The peak demand in 2011 was similar to the all time high in 2007, although it should be noted it occurred before the typical winter peak period, indicating the shift in demand from winter. • The summer demand in 2011 was generally higher than that previously experienced. • There was an increase in the annual “energy sent out” (incl sales to Eskom from non Eskom generation) of about 1.3% (Y-Y)
2012 load growth • Initial weeks showed a slightly higher demand than 2011, but initiatives are in place to reduce demand and results have been seen over the last few weeks. • There has been about 0.5% energy growth Y-Y compared to the same time last year (including non Eskom sales to Eskom)
Constrained generation trends – OCGT usage • In 2011 we used our OCGTs more to ensure that as much as possible maintenance is done while keeping the lights on. This has been continued in 2012. • However there is still a maintenance backlog.
Reserve utilisation • Although a similar number of incidents of usage of emergency and supplemental demand side options occurred, there has been a substantial increase in the volume of OCGT usage to accommodate maintenance.
Generation availability • The full and partial generation load losses are indicated above. There was a peak in November 2011 and January 2012. This has contributed to the increase in OCGT utilisation as well as influenced the availability of opportunity for maintenance.
What do we expect in summer 2012 • Year to date the system has been extremely tight with frequent use made of emergency reserves. • Higher than normal OCGT load factors are an indication of the tightness the system has been operated at to accommodate maintenance. • However planned maintenance requirements still exceed the capacity available for maintenance. • In addition, generation forced outages have contributed to this, both full units and partial load losses at various stations for a number of reasons. • This situation is not expected to ease off as outages that have previously been postponed are now getting to a point where they have to be done, for technical and statutory reasons.
Expected system status • With all gas we should be operating in the green. • Our normal planning assumption is 3600MW unplanned with 4 500MW being a risk assessment. • It is clear that without deferring maintenance, the system status is more risky.
Maintenance outlook Jan - Jul 2012 For maintenance scheduling, 1300MW of OCGT capacity is considered and the ideal scenario is to operate in the “green” zone. In planning mode, an “orange”, “red” or “brown” status is unacceptable and outages will have to be deferred. Operation within the “green” zone is needed to manage typical risks, such as loss of a large nuclear unit, loss of imports from Cahora Bassa or multiple unit trips at the coal stations. • Green : Sufficient capacity to meet demand, reserves and allowance for planned and unplanned maintenance of generation plant. Yellow : 0 to 1000MW short of capacity needed. Orange : 1000 to 2000 MW short of capacity needed. Red : 2000 to 4000MW short of capacity needed. Brown : Greater than 4000MW short of capacity needed 10
Required Capacity to ensure stable system operation • Ideally, 3 000 MW of committed capacity from supply and demand initiatives is needed immediately to keep the lights on and enable maintenance to continue. • Reducing this target will require a significant adjustment to the maintenance programme. • Between now and end-December 2013, the minimum targets set out in the table below need to be achieved to prevent an emergency.
Way Forward Eskom has set up a recovery team to: • Execute the plan to secure identified and approved demand and supply levers. • Step up communications to encourage greater energy efficiency. • Be clear about our maintenance philosophy and the governance processes to manage risk and specify operating envelopes for power generation plants. • Implement an effective outage strategy, using maintenance windows to reduce the backlog, deal with emerging risks and conduct scheduled, design-based maintenance. • Implement a more sustainable maintenance philosophy throughout the generation fleet. The Department of Public Enterprises has established a task team with Eskom to develop the detailed delivery schedule and review progress, coordinate activities that require Government intervention, prepare updates for Cabinet and align communication and stakeholder plans.
What has been done • Signed power purchase agreements (PPA’s) with the two municipalities to secure baseload generation. • Secured available non-Eskom generation from customer base on a short term basis. • Signed power buyback agreements, where we were able to remove base demand off the system, while some were deferred to the winter period. • Obtained voluntary co-operation over peak periods from large customers (at least 400MW) • Additional DMP has been obtained and non Eskom peaking plant is being finalised • Demand Response Aggregator Pilot Program (DRAPP) has been initiated and an additional 500 MW of demand response is expected by winter • Identified possible cross border generation and engagements are currently taking place.
Summing up • South Africa’s power system will be tight for the next few years: the next two years are critical. • Summer is maintenance season in Eskom. System is being run at higher levels of risk to tackle backlog and keep up with maintenance while at the same time meeting demand. • Strategy of shifting maintenance outages can no longer be sustained. • We need to save 10% of our current energy demand and remove 3000MW from our demand to ensure that the power system can be operated in a stable mode and that adequate maintenance is done on the generation fleet to provide safe and sustainable performance.