Download
1 / 29
290 likes | 295 Views
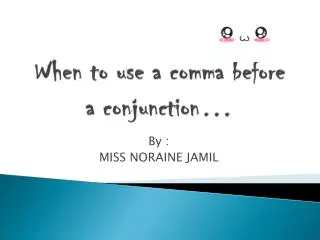
Focus Plan: Function Conjunction. PowerPoint Presentation Focus Activity and Instruction. They say… A picture is worth a thousand words. Is it? Which means more?. USA Today reports:.

E N D
Focus Plan: Function Conjunction PowerPoint Presentation Focus Activity and Instruction
They say…A picture is worth a thousand words • Is it? • Which means more?
USA Today reports: • A heavy battle took place between the U.S. Army's 7th Cavalry Regiment and Iraqi forces on March 25, 2003 near the village of Al Faysaliyah, Iraq. A number of civilians, including children, were injured. • Or this…
Retrieved from: http://www.usatoday.com/news/world/iraq/2003-07-06-photo-boy_x.htm
This? • April 16, 2007A gunman kills 32 people in a dorm and a classroom building at Virginia Tech in Blacksburg, Va. The suspect then dies by gunshot himself.
Or This? Retrieved from http://www.time.com/time/photoessays
In Math, as in life • Pictures often mean more than words
The following slides will give you information about the number of high school dropouts there were in the U.S. between 1995 and 2001
Which representation of the data was easier to interpret? The Table? Or the Graph?
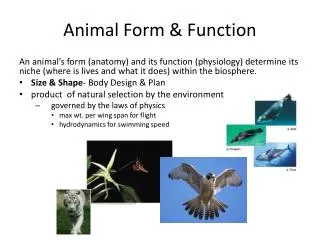
Classroom Instruction • TAKS Objective 2: The student will demonstrate an understanding of the properties and attributes of functions. • TEK A. 1 (D) Represent relationships among quantities using concrete models, tables, graphs, diagrams, verbal descriptions, equations, and inequalities
Graph: A picture which represents a relationship (usually functional) For most people, a graph or diagram is easier to comprehend than a chart with words & numbers
In math • We must be able to represent relationships in many ways
Today we will study –representing math relationships Meaning… Can you take a functional relationship and represent it with a: table model graph diagram equation inequality description mapping
Lets Practice • With some TAKS questions
The function f(x) = {(1, 2), (2, 4), (3, 6), (4, 8)} Can be represented in several other ways. Which is NOT a correct representation of the function f(x)? H x is a natural number less than 5 and y is twice x J y = 2x and the domain is {1, 2, 3, 4} 9th Grade 9 TAKS
Which Inequality best describes the graph below? A y > -¾ x + 5 B y < -4/3 x + 5 C y < - ¾ x + 5 D y > -4/3 x + 5 Grade 9 TAKS
Which inequality best describes the graph shown below? F y≥ -2x G y ≥ -x – 2 H y ≥ -2x – 2 J y ≥ x – 2 Grade 10 TAKS
Which mapping best represents the functiony = 2x2 + 1 when the replacement set for x is {-1, 0, 3}? Grade 10 TAKS
Which data set is best described by the function y = -2x2 + 5x? Grade 10 TAKS
Which quadratic equation best represents the parabola shown below? A y = x2 + x + 5 B y = x2 + 5 C y = -x2 + 5 D y = -x2 + x + 5 Exit Level TAKS
Represent the following LIST of ordered pairs as a Table: {(-1, -4), (0, -1), (3, 8), (5, 14), …}
Represent the following LIST of ordered pairs as a Mapping: {(-1, -4), (0, -1), (3, 8), (5, 14)}
Represent the following LIST of ordered pairs as a Verbal Description:{(-1, -4), (0, -1), (3, 8), (5, 14)…} • The y-values for a set of points are 1 less than 3 times the corresponding x-values
Represent the following LIST of ordered pairs as an Equation: {(-1, -4), (0, -1), (3, 8), (5, 14)…} y = 3x - 1
Represent the following LIST of ordered pairs in Functional Notation:{(-1, -4), (0, -1), (3, 8), (5, 14)…} f(x) = 3x - 1
Represent the following LIST of ordered pairs as a graph:{(-1, -4), (0, -1), (3, 8), (5, 14)…}
You must know how -- • To represent functions in many ways and • To determine whether two different representations of a function are equivalent