Download
1 / 57
570 likes | 596 Views
Explore the concept of ecosystems, including the modes of nutrition, trophic levels, food chains, energy losses, and primary productivity. Learn about biological magnification and the impact of DDT on food webs.

E N D
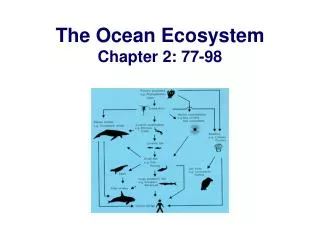
Ecosystem An association of organisms and their physical environment, interconnected by ongoing flow of energy and a cycling of materials
Modes of Nutrition • Autotrophs • Capture sunlight or chemical energy • Producers • Heterotrophs • Extract energy from other organisms or organic wastes • Consumers, decomposers, detritivores
Simple Ecosystem Model energy input from sun PHOTOAUTOTROPHS (plants, other producers) nutrient cycling HETEROTROPHS (consumers, decomposers) energy output (mainly heat)
SPRING Consumers • Herbivores • Carnivores • Parasites • Omnivores • Decomposers • Detritivores fruits insects rodents, rabbits birds SUMMER fruits rodents, rabbits insects birds Seasonal variation in the diet of an omnivore (red fox)
Trophic Levels • All the organisms at a trophic level are the same number of steps away from the energy input into the system • Producers are closest to the energy input and are the first trophic level
Trophic Levels in Prairie Fourth-level consumers (heterotrophs): 5th Top carnivores, parasites, detritivores, decomposers Third-level consumers (heterotrophs): 4th Carnivores, parasites, detritivores, decomposers Second-level consumers (heterotrophs): 3rd Carnivores, parasites, detritivores, decomposers First-level consumers (heterotrophs): 2nd Herbivores, parasites, detritivores, decomposers Primary producers (autotrophs): 1st Photoautotrophs, chemoautotrophs
Food Chain marsh hawk • A straight-line sequence of who eats whom • Simple food chains are rare in nature upland sandpiper garter snake cutworm plants
marsh hawk crow garter snake cutworm flowering plants Fig. 47-4, p.845
Tall-Grass Prairie Food Web marsh hawk sandpiper crow snake frog coyote weasel badger spider sparrow pocket gopher ground squirrel vole earthworms, insects grasses, composites
marsh hawk Sampling of connections in a tallgrass prairie food web Higher Trophic Levels crow upland sandpiper garter snake frog weasel badger coyote spider Second Trophic Level sparrow prairie vole pocket gopher ground squirrel earthworms, insects First Trophic Level grasses, composites Fig. 47-5, p.846
Energy Losses • Energy transfers are never 100 percent efficient • Some energy is lost at each step • Limits the number of trophic levels in an ecosystem
Energy Input: Grazing Food Web Detrital Food Web Energy Input: Two Types of Food Webs Transfers: Transfers: Producers (photosynthesizers) Producers (photosynthesizers) energy losses as metabolic heat & as net export from ecosystem energy in organic wastes, remains energy in organic wastes, remains energy losses as metabolic heat & as net export from ecosystem herbivores decomposers decomposers carnivores detritivores detritivores decomposers Energy Output Energy Output Figure 47.6 Page 847
Biological Magnification A nondegradable or slowly degradable substance becomes more and more concentrated in the tissues of organisms at higher trophic levels of a food web
DDT in Food Webs • Synthetic pesticide banned in United States since the 1970s • Almost caused Bald Eagles to go Extinct • Birds that are carnivores accumulate DDT in their tissues, produce brittle egg shells
DDT in an Estuary (1967) DDT Residues (ppm wet weight of whole live organism) Ring-billed gull fledgling (Larus delawarensis) Herring gull (Larus argentatus) Osprey (Pandion haliaetus) Green heron (Butorides virescens) Atlantic needlefish (Strongylira marina) Summer flounder (Paralychthys dentatus) Sheepshead minnow (Cyprinodon variegatus) Hard clam (Mercenaria mercenaria) Marsh grass shoots (Spartina patens) Flying insects (mostly flies) Mud snail (Nassarius obsoletus) Shrimps (composite of several samples) Green alga (Cladophora gracilis) Plankton (mostly zooplankton) Water 75.5 18.5 13.8 3.57 2.07 1.28 0.94 0.42 0.33 0.30 0.26 0.16 0.083 0.040 0.00005
Primary Productivity • Gross primary productivity is ecosystem’s total rate of photosynthesis • Net primary productivity is rate at which producers store energy in tissues in excess of their aerobic respiration
Primary Productivity Varies • Seasonal variation • Variation by habitat • The harsher the environment, the slower plant growth, the lower the primary productivity
north temperate north polar tropical Photosynthetic biomass JAN FEB MAR APR MAY JUNE JULY AUG SEPT OCT NOV DEC JAN Fig. 47-10b, p.850
Silver Springs Study • Aquatic ecosystem in Florida • Site of a long-term study of a grazing food web third-level carnivores (gar, large-mouth bass) 1.5 second-level consumers (fishes, invertebrates) 1.1 decomposers, detritivores (bacteria, crayfish) first-level consumers (herbivorous fishes, turtles, invertebrates) 37 primary producers (algae, eelgrass, rooted plants) 809 5
Pyramid of Energy Flow • Primary producers trapped about 1.2 percent of the solar energy that entered the ecosystem • 6-16% passed on to next level decomposers + detritivores = 5,080 21 top carnivores carnivores 383 herbivores 3,368 producers 20,810 kilocalories/square meter/year Figure 47.13 Page 851
ENERGY INPUT: Incoming solar energy not harnessed: 1,679,190 (98.8%) 1,700,000 kilocalories 20,810 (1.2%) Energy losses as metabolic heat & as net export from ecosystem: Energy in organic wastes and remains: Producers To next trophic level: 3,368 4,245 13,197 Herbivores 383 2,265 720 Carnivores 21 272 90 Top carnivores 16 5 Decomposers, detritivores 5,060 ENERGY OUTPUT: Total annual energy flow: 1,700,000 (100%) Energy Flow In Silver Springs 20,810 1,679,190 Figure 47-13 Page 851
All Heat in the End • At each trophic level, the bulk of the energy received from the previous level is used in metabolism • This energy is released as heat energy and lost to the ecosystem • Eventually all energy is released as heat
Biogeochemical Cycle • The flow of a nutrient from the environment to living organisms and back to the environment • Main reservoir for the nutrient is in the environment
geochemical cycle Main nutrient reservoirs in the environment fraction of nutrient available to ecosystem herbivores, carnivores, parasites primary producers detritivores, decomposers Fig. 47-14, p.852
Three Categories • Hydrologic cycle • Water • Atmospheric cycles • Nitrogen and carbon • Sedimentary cycles • Phosphorus and sulfur
Water Use and Scarcity • Most of Earth’s water is too salty for human consumption • Desalinization is expensive and requires large energy inputs • Irrigation of crops is the main use of freshwater
Aquifer Problems Figure 47-19 Page 855
Carbon Cycle • Carbon moves through the atmosphere and food webs on its way to and from the ocean, sediments, and rocks • Sediments and rocks are the main reservoir
diffusion between atmosphere and ocean Carbon Cycle - Marine combustion of fossil fuels bicarbonate and carbonate in ocean water aerobic respiration photosynthesis marine food webs death, sedimentation incorporation into sediments uplifting sedimentation marine sediments Figure 47-20 Page 856
Carbon Cycle - Land atmosphere combustion of fossil fuels volcanic action aerobic respiration combustion of wood photosynthesis terrestrial rocks sedimentation weathering land food webs soil water peat, fossil fuels death, burial, compaction over geologic time leaching, runoff Figure 47-20 Page 856
Carbon in Atmosphere • Atmospheric carbon is mainly carbon dioxide • Carbon dioxide is added to atmosphere • Aerobic respiration, volcanic action, burning fossil fuels • Removed by photosynthesis
Greenhouse Effect • Greenhouse gases impede the escape of heat from Earth’s surface Figure 47-22, Page 858
Global Warming Long-term increase in the temperature of Earth’s lower atmosphere
Carbon Dioxide Increase • Carbon dioxide levels fluctuate seasonally • The average level is steadily increasing • Burning of fossil fuels and deforestation are contributing to the increase
Other Greenhouse Gases • CFCs - synthetic gases used in plastics and in refrigeration • Methane - produced by termites and bacteria • Nitrous oxide - released by bacteria, fertilizers, and animal wastes
Nitrogen Cycle • Nitrogen is used in amino acids and nucleic acids • Main reservoir is nitrogen gas in the atmosphere
Nitrogen Cycle Nitrogen cycle
Nitrogen Fixation • Plants cannot use nitrogen gas • Nitrogen-fixing bacteria convert nitrogen gas into ammonia (NH3) • Ammonia and ammonium can be taken up by plants
Ammonification & Nitrification • Bacteria and fungi carry out ammonification • conversion of nitrogenous wastes to ammonia • Nitrifying bacteria convert ammonium to nitrites and nitrates