Download
1 / 21
210 likes | 218 Views
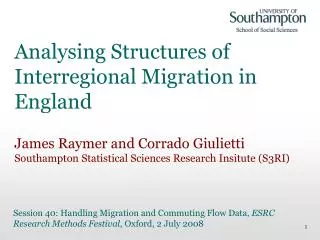
Analysing Structures of Interregional Migration in England. James Raymer and Corrado Giulietti Southampton Statistical Sciences Research Insitute (S3RI). Session 40: Handling Migration and Commuting Flow Data, ESRC Research Methods Festival , Oxford, 2 July 2008. Context and significance.

E N D
Analysing Structures of Interregional Migration in England James Raymer and Corrado Giulietti Southampton Statistical Sciences Research Insitute (S3RI) Session 40: Handling Migration and Commuting Flow Data, ESRC Research Methods Festival, Oxford, 2 July 2008
Context and significance • Context • First part of an ESRC-funded project on combining census and registration migration data in England and Wales • Significance • Helps us to better understand aggregate population change and migration behaviour • Provides a basis for the estimation of migration patterns, including projection
Outline • Introduction • Analysing migration structures • Multiplicative component framework • Log-linear models • Interregional migration in England • Analysis of multiplicative components • Log-linear analyses of migration flow tables • Summary and next steps
Data • 1991 and 2001 censuses • Interregional migration flows in England • Origin (9) by destination (9) by age (16) • Origin (9) by destination (9) by ethnicity (4) • Inconsistencies in measurement over time • Student population • Mixed ethnicity group
Multiplicative component model for a 2-way table: Origin by destination Migration flow table Multiplicative components nij = (T)(Oi)(Dj)(ODij), where T = n++ Oi =ni+ / T Dj = n+j / T ODij = nij / (T)(Oi)(Dj)
Multiplicative Models for Three-Way Tables • Interregional migration by age • Interregional migration by ethnicity Overall Level Main Effects (proportions) Two-way Inteactions (odds) Three-way Interaction (odds ratios)
Log-linear models for analysing structures in three-way migration flow tables • Saturated model: ODE • Unsaturated model (mutual independence): O, D, E • Unsaturated model: OD, E Note, we use the likelihood ratio statistic (G2) and the Akaike Information Criteria (AIC) to compare the overall fits of unsaturated models
Overall levels 1991: 630 thousand 2001: 920 thousand The proportions of all migration from and to each region in England, 1991 and 2001
The observed to expected ratios of interregional migration (ODij) in England, 1991 2.783 = 5,159 / (628,610 * 0.082 * 0.036) = 5,159 / 1,854 0.539 = 6,046 / (628,610 * 0.220 * 0.081) = 6,046 / 11,225
The observed to expected ratios of interregional migration (ODij) from Yorkshire and the Humber and London, 1991 and 2001
Proportions of all interregional migration in England by age, 1991 and 2001
OAix Origin-age and destination-age interaction effects of interregional migration in England, 1991 and 2001: London DAjx
Proportions of all interregional migration in England by ethnicity, 1991 and 2001
OEig DEjg Origin-ethnicity and destination-ethnicity interaction effects of interregional migration in England, 1991 and 2001: White
OEig DEjg Origin-ethnicity and destination-ethnicity interaction effects of interregional migration in England, 1991 and 2001: South Asian
OEig DEjg Origin-ethnicity and destination-ethnicity interaction effects of interregional migration in England, 1991 and 2001: Black
A comparison of unsaturated log-linear model fits: England migration tables cross-classified by origin (O), destination (D), age (A) and time (T) Note, df = residual degrees of freedom
North East to London London to North East Estimated age patterns of migration between North East and London and South West, 2001 A comparison of two unsaturated log-linear models South West to London London to South West
A comparison of unsaturated log-linear model fits: England migration tables cross-classified by origin (O), destination (D), ethnicity (E) and time (T) Note, df = residual degrees of freedom
Estimated South Asian interregional migration from North East and London, 1991 and 2001: A comparison of two unsaturated log-linear models
Main points • Despite a large increase in the level of interregional migration, the underlying structures have remained remarkably stable over time (except with some of the ethnic structures) • Large differences in the patterns occur by age (not much change over time) and ethnicity (lots of change over time) • The three-way interaction terms of the multiplicative model do not contribute much to the overall fit • Future work • Extend analysis to county level and other variables (e.g., education and employment) • Build model for combining census and registration migration data to estimate detailed patterns annually over time