Download
1 / 22
220 likes | 222 Views
UNSD/UNEP Questionnaire 2013 on Environment Statistics. Waste statistics. Reena Shah United Nations Statistics Division (UNSD) CARICOM Workshop on Environment Statistics (Kingstown, St. Vincent & the Grenadines , 7-8 April 2014). I. UNSD data collection in env . statistics.

E N D
UNSD/UNEP Questionnaire 2013 on Environment Statistics Waste statistics Reena Shah United Nations Statistics Division (UNSD) CARICOM Workshop on Environment Statistics (Kingstown, St. Vincent & the Grenadines, 7-8 April 2014)
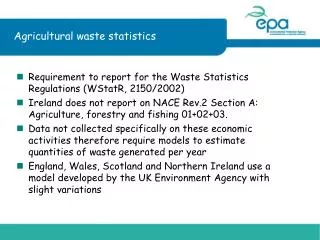
I. UNSD data collection in env. statistics • UNSD/UNEP Questionnaire 2013 on Environment Statistics – being sent out in April and focuses on water and waste statistics (http://unstats.un.org/unsd/environment/questionnaire2013.htm) • Water statistics – The tables cover renewable freshwater resources, freshwater abstraction and use, water supply industry, wastewater generation and treatment, and population connected to waste water treatment. • Waste statistics – The tables cover the generation of waste, the generation and treatment of hazardous waste, and the generation, collection, treatment, and composition of municipal waste.
UNSD/UNEP Questionnaire - water statistics • Renewable Freshwater Resources (W1) • Freshwater Abstraction and Use (W2) • Water supply industry (ISIC 36) (W3) • Wastewater Generation and Treatment (W4) • Population Connected to Wastewater Treatment (W5)
Precipitation (W1,1) Actual evapotranspiration (W1,2) W1 W2 Outflow of surface and groundwaters to neighbouring countries (W1,6) Internal flow (W1,3) Inflow of surface and groundwaters from neighbouring countries (W1,4) Renewable freshwater resources (W1,5) of which abstracted by Water supply industry (W2,4) Households (W2,5) Agriculture, forestry and fishing (ISIC 01-03) (W2,6) Manufacturing (ISIC 10-33) (W2,7) Electricity industry (ISIC 351) (W2,8) Other economic activities (W2,9) Freshwater abstracted (W2,3) Households (W2,17) Agriculture, forestry and fishing (ISIC 01-03) (W2,18) Desalinated water (W2,10) Total freshwater available for use (W2,14) Total freshwater use (W2,16) of which used by: Manufacturing (ISIC 10-33) (W2,20) Reused water (W2,11) Electricity industry (ISIC 351) (W2,21) Imports of water -Exports of water (=W2,12)-(W2,13) Losses during transport (W2,15) Other economic activities (W2,22) Outflow of surface and groundwaters to the sea (W1,9)
Chart W1: Renewable Freshwater Resources Precipitation (W1,1) Actual evapotranspiration (W1,2) Internal flow (W1,3) Outflow of surface and groundwaters to neighbouring countries (W1,6) Inflow of surface and groundwaters from neighbouring countries (W1,4) Renewable freshwater resources (W1,5) Outflow of surface and groundwaters to the sea (W1,9)
Freshwater abstracted (W2,3) Chart W2: Freshwater Abstraction and Use Households (W2,17) of which abstracted by: Total freshwater available for use (W2,14) Total freshwater use (W2,16) Water supply Industry (ISIC 36) (W2,4) of which used by Desalinated water (W2,10) Agriculture, forestry and fishing (ISIC 01-03) (W2,18) Households (W2,5) Reused water (W2,11) Losses during transport (W2,15) Agriculture, forestry and fishing (ISIC 01-03) (W2,6) Manufacturing (ISIC 10-33) (W2,20) Manufacturing (ISIC 10-33) (W2,7) Imports of water minus exports of water =(W2,12)-(W2,13) Electricity Industry (ISIC 351) (W2,21) Electricity Industry (ISIC 351) (W2,8) Other economic activities (W2,22) Other economic activities (W2,9)
Households (W3,4) Agriculture, forestry and fishery (ISIC 01-03) (W3,5) Gross freshwater supplied by water supply industry (ISIC 36) (W3,1) Net freshwater supplied by water supply industry (ISIC 36) (W3,3) of which supplied to: Manufacturing (ISIC 10-33) (W3,6) Electricity industry (ISIC 351) (W3,7) Other economic activities (W3,8) Losses during transport by ISIC 36 (W3,2) Chart W3: Water Supply Industry (ISIC 36)
Chart W4: Wastewater Generation and Treatment Wastewater treated in urban wastewater treatment plants (W4,7) Agriculture, forestry and fishing (ISIC 01-03) (W4,2) Total wastewater generated (W4,1) Manufacturing (ISIC 10-33) (W4,3) Wastewater treated in other treatment plants (W4,11) Electricity industry (ISIC 351) (W4,4) Wastewater treated in independent treatment facilities (W4,15) Other economic activities (W4,5) Non-treated wastewater(W4,16) Households (W4,6)
UNSD/UNEP Questionnaire – waste statistics • Generation of Waste by Source (R1) • Management of Hazardous Waste (R2) • Management of Municipal Waste (R3) • Composition of Municipal Waste (R4) • Management of Municipal Waste – City data (R5)
Chart R2: Management of Hazardous Waste Stock of hazardous waste at the beginning of the year (R2,1) Hazardous waste generated during the year (R2,2) [+] Hazardous waste treated or disposed of during the year (=6+7+8+9+10) (R2,5) [-] Hazardous waste exported during the year (R2,4) (-) Hazardous waste imported during the year (R2,3) [+] Stock of hazardous waste at the end of the year (=1+2+3-4-5) (R2,11)
UNSD Questionnaires: 1999-2010: Responses as of 15 February 2011
II. UNSD data collection and dissemination (cont.) UNSD disseminates data through: • UNSD Environmental Indicators (Air and climate, Biodiversity, Energy and minerals, Forests, Governance, Inland water resources, Land and agriculture, Marine and coastal areas, Natural disasters, and Waste) (http://unstats.un.org/unsd/environment/qindicators.htm) • Country Files (access restricted to countries and international organizations that participate in the data collection (http://unstats.un.org/unsd/environment/Questionnaires/index.asp) • Country Snapshots (include UNSD environmental indicators and other economic/demographic data (http://unstats.un.org/unsd/environment/Questionnaires/country_snapshots.htm) • Environment statistics in UNData (http://data.un.org/)