Download
1 / 26
260 likes | 267 Views
Climate Variability and Trends in Australia. David Walland Bureau of Meteorology Carbon-Drought Workshop 5-8 June Canberra. Outline. An introduction to Australian climate (rainfall) variability The emergence of climate change amongst the variability Projections.

E N D
Climate Variability and Trends in Australia David Walland Bureau of Meteorology Carbon-Drought Workshop 5-8 June Canberra
Outline • An introduction to Australian climate (rainfall) variability • The emergence of climate change amongst the variability • Projections
A Long History of Rainfall Variability • Australia is unique amongst developed countries. Natural and human systems must be adapted to a boom bust climate (100 years of data for Australia and generally also for the other countries)
Impact on Biosphere • Droughts clearly impact on water limited vegetation e.g. tree mortality (Breshears et al 2005), crop yield etc. • Bushfires have a major impact on all types of vegetation • Drought associated with the lead up to the 2002/03 bushfires • Extreme event to trigger fires e.g. Wilsons Prom bushfires (April 2005 was nationally hottest April on record (largest temp anomaly on record) & fires occured during a record breaking heatwave)
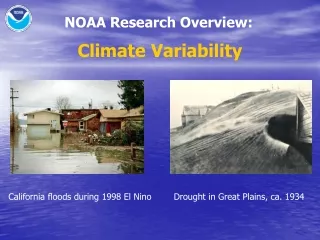
Significant drivers of Rainfall Variability • Natural variability in Australian rainfall is due to many factors, some chaotic. • El Nino is one of the more dominant predictable influences. • 1998-99 and 2002-03 were La Nina and El Nino years respectively. The Walker Circulation - “normal” and El Nino
Emerging Climate Trends High-quality rainfall dataset: Annual trends
High-Quality Annual Temperature • 1910-2005 trends: • Max T: +0.06°C/decade • Min T: +0.12°C/decade
Impact of Extremes • systems have adaptive capacity so they may be stressed but can often cope with slow changes in the mean • extremes events can exceed their adaptive capacity and tip the system over the edge e.g. • hot days …. Bushfires • Tropical cyclones ….wind damage, saltwater intrusion • there is much on-going research into frequency of extreme events
High-quality Daily Temperature: Daily Extremes • Shifts consistent with changes in mean • Averaged over “valid” regions only • Updated from Collins et al. (2000) Hot Days: Max T ≥35oC Cold Days: Max T ≤ 15oC Hot Nights: Min T ≥ 20oC Cold Nights: Min T ≤ 5oC
Sea Surface Temperature TrendsSmith and Reynolds (2004) • Free from urban influence, show rapid warming about SE Australia => interesting insight into the synoptic changes
El-Nino • Walker Circulation has been observed to be weaker over the past century which implied a more El Nino like state in the Pacific. • Consistent with observed rainfall trends • No consensus about the future evolution and whether this scenario is likely to continue.
Changing weather systems & rainfall Reductions in Southern Australian rainfall are likely due to changes in the dominant weather systems themselves. A southward shift in the frontal/low pressure system genesis region would have a huge impact on Southern Australia Such a change has been mechanically linked to increases in greenhouse gases and reductions in polar ozone.
Impacts on water resources A slow forcing give rise to a rapidly changing resource outcome.
The SE Australian 10 Year Drought An unprecedented and protracted hydrological drought affecting much of southeast Australia Also, warmest period on record.
Increased temperatures have increased moisture stress The drought of 2002 was one of Australia’s most severe due to record high temperatures, not record low rainfall. Vegetation health (condition) due to water availability and temperatures, based on satellite data. Drought regions with vegetation under stress are shown in red. (Kogan, 1997) Obtained from NOAA, USA from http://orbit35i.nesdis.noaa.gov/crad/sat/surf/vci/aus.html
Future projections of climate change The latest IPCC assessment of all scientific literature on Climate Change is due for release next year It concludes that recent warming is highly likely (>90% chance) due to human influences on climate. Modelling centres around the world are running forward projections of climate that is forced with expected increases to greenhouse gases. • Global mean warming 1.4-5.8C by 2100 • Mean sea-level rise 9-88cm by 2100
A synthesis of climate models produces a range of likely rainfall changes in Australia under global warming scenarios Almost all the models agree on reduced rainfall for Southern Australia
Model predicted temperature changes in Australia under global warming scenarios Continental wide warming will result from greenhouse gas increases.
Conclusions • Australia is a relatively dry country with a high natural variability in its rainfall regime • Natural and human systems have high capacity to deal with such variability but are undoubtedly impacted by droughts, bushfires, storms etc • Climate in Australia is changing – temp, rainfall, mean, extremes • Extreme events; droughts, record high temps, bushfires impact more obviously on biosphere than changes in mean
Conclusionscont… • Changes in rainfall regimes already noted can be interpreted in terms of changing dynamical patterns • The combined impact of temperature and rainfall changes can be severe for the biosphere • Projections indicate a drier southern Australia with hints of a drier eastern Australia and a wetter north-west Australia but higher temperatures are clear everywhere
Extreme and Mean Rainfall Variations Over Australia Rainfall deficiencies consistent with variations in mean. Some years “drought free” others “drought dominates Australia”
Summary of Current Climate Change/Long-Term Variability Knowledge
Seasonal Signal AUT WIN SPR SUM